
We are excited to introduce a new addition to our suite of investment strategies – The Defense Strategy.
It combines Mutiny Fund’s Volatility Strategy and Commodity Trend Strategy. The Volatility Strategy is designed to act as a so-called ‘black swan’ investment, achieving asymmetric gains in times of high volatility or tail risk (e.g. March 2020). The Commodity Trend Strategy is designed to profit during inflationary periods (e.g. 2022) as well as during extended ‘crisis periods’ for stocks and bonds (e.g. 2008).
In combining these two exposures, the Defense Strategy seeks to achieve flat to slightly positive returns during positive periods for stock and bond portfolios while providing its most significant returns in periods of equity market drawdowns or high inflation.
The Defense Strategy is part of the holistic Cockroach Strategy and is intended as a diversifier to be combined with offensive assets in an investor’s portfolio such as stocks, bonds, and private equity.
In this note, we talk through how and why we developed the Defense Strategy and the role we believe it can serve in investors’ portfolios.
Two individuals have similar average incomes, savings rates and investments returns over their life. How different could we expect their financial lives to be?
The intuitive answer is not that different, right?
Well, there’s one enormous variable that isn’t accounted for: time. An investor born at the ‘wrong’ time can fare dramatically worse than an investor born at the ‘right’ time due to no fault of their own. The difference in outcomes can be stark: the difference between being financially secure or not.
How to Drown in a River that is Two Feet Deep
Let’s look at a simple example. From 1966 to 1997 the Dow Index grew about 715% – a roughly 8% average annual return.
However, those returns varied greatly over time. From 1966 through 1982 there are essentially no returns. $1,000 invested into the Dow Index at the beginning of 1966 was only worth about $1080 by the end of 1982. Then, from 1982 through 1997 the Dow grew at about 15% per year taking the index from 875 to almost 8000.
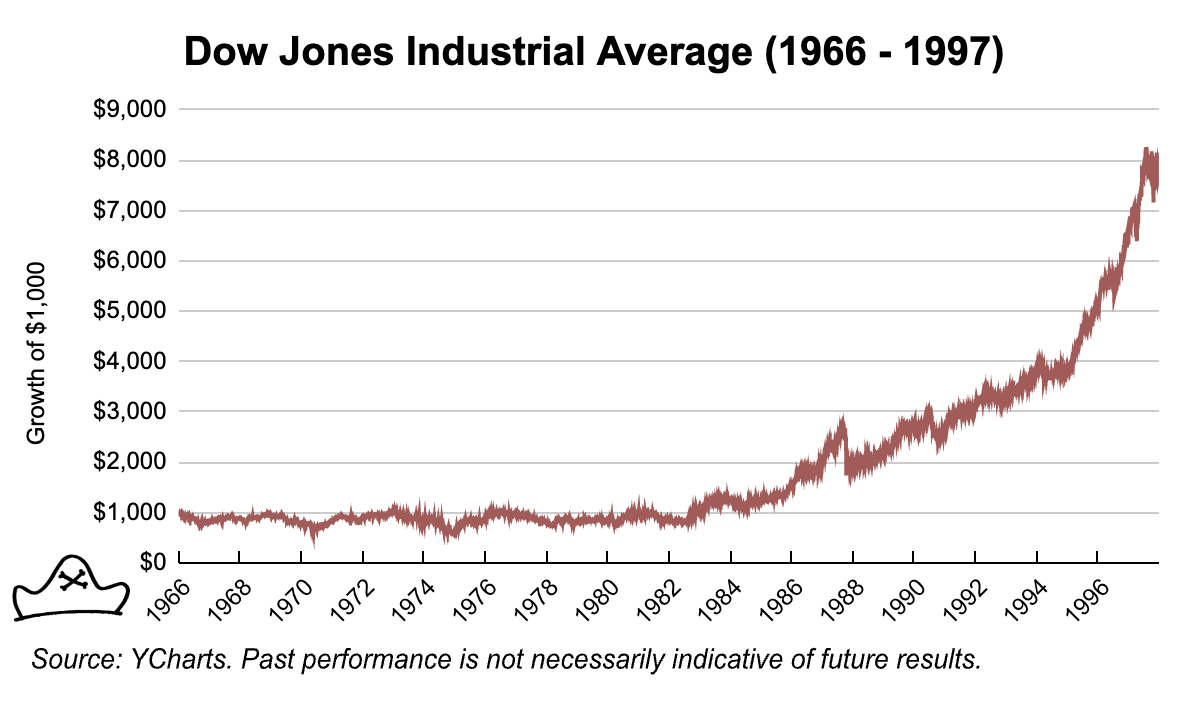
Even though the average return was 8% over that period, the implications for an investor vary dramatically based on what order the returns come in.
Consider a couple, Nick and Nancy, that has accumulated $3,000,000 in savings. They are ready to retire at age 63 and expect to draw $180,000 per year with that amount increasing 3% each year to account for inflation.
If they experience the strong return period (1982-1997) first and the poor return period last (blue line) then they will have more than enough funds to last through their retirement. Their wealth will increase even as they are withdrawing funds for the first decade or so leaving them plenty to draw down on in their later years.
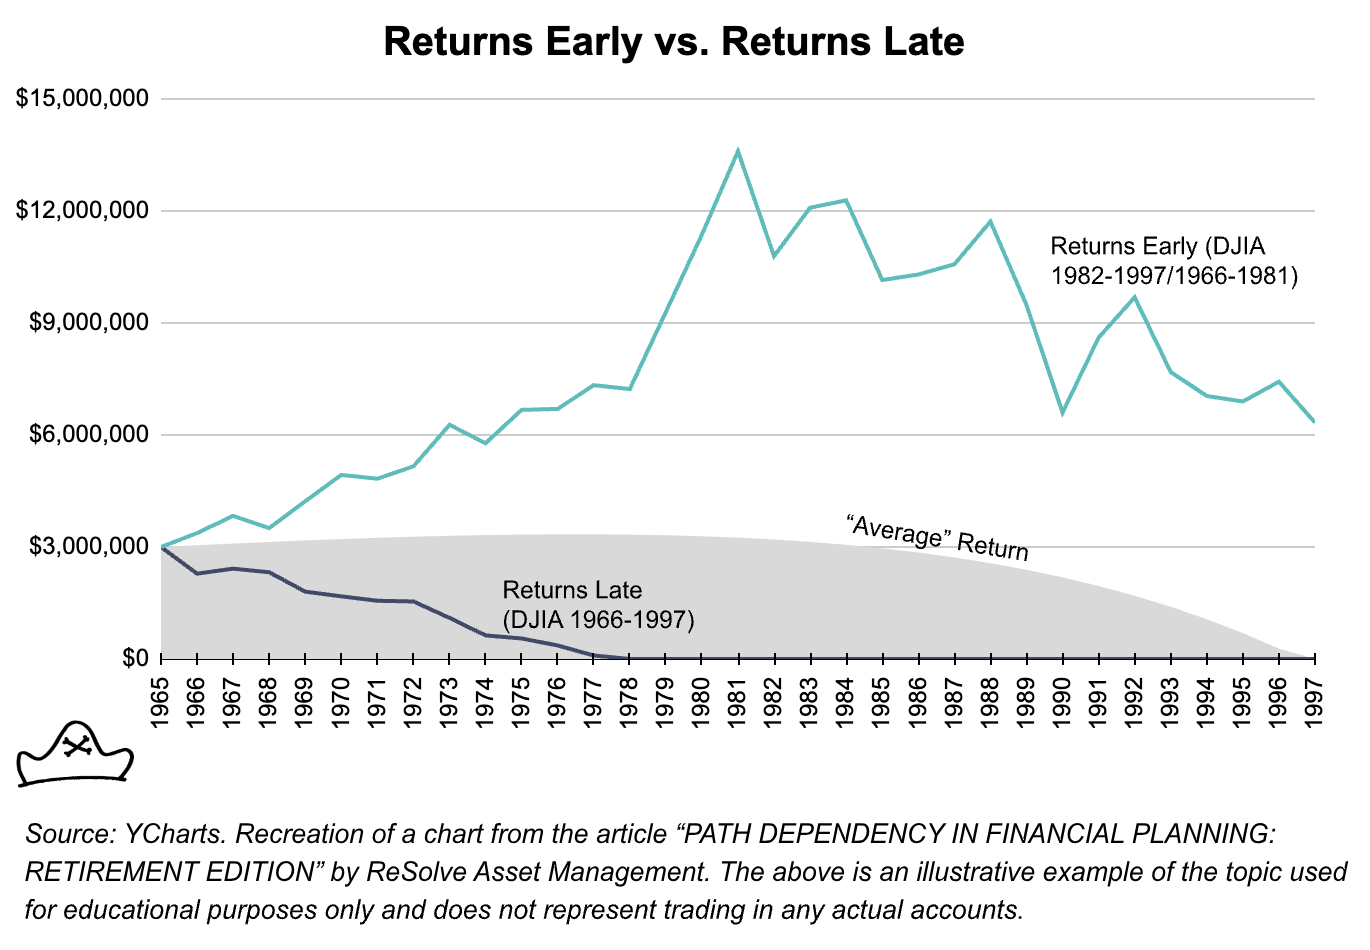
However, if they get the returns in the order they actually happened, with a long flat period for the first 15 years, they go broke at age 76 (red line).
Time matters. If big positive returns come early, Nick and Nancy are in great shape. If they come late, they are ruined.
It’s not just retirees for whom this matters, consider a 32 year old starting with $100,000 in savings and adding $1,000 per month to their savings account. If they get good returns early (when they have relatively little savings) and the flat returns late, then they are in trouble. They finish with less than $1,000,000 ($913,815) at age 63, when they are ready to retire.
Conversely, if the flat returns come early and good returns come later when they have more capital to compound, they arrive at age 65 with $3,355,768 in savings. Achieving the smoother average return of 8% arrives at a similar figure of $2,955,960.
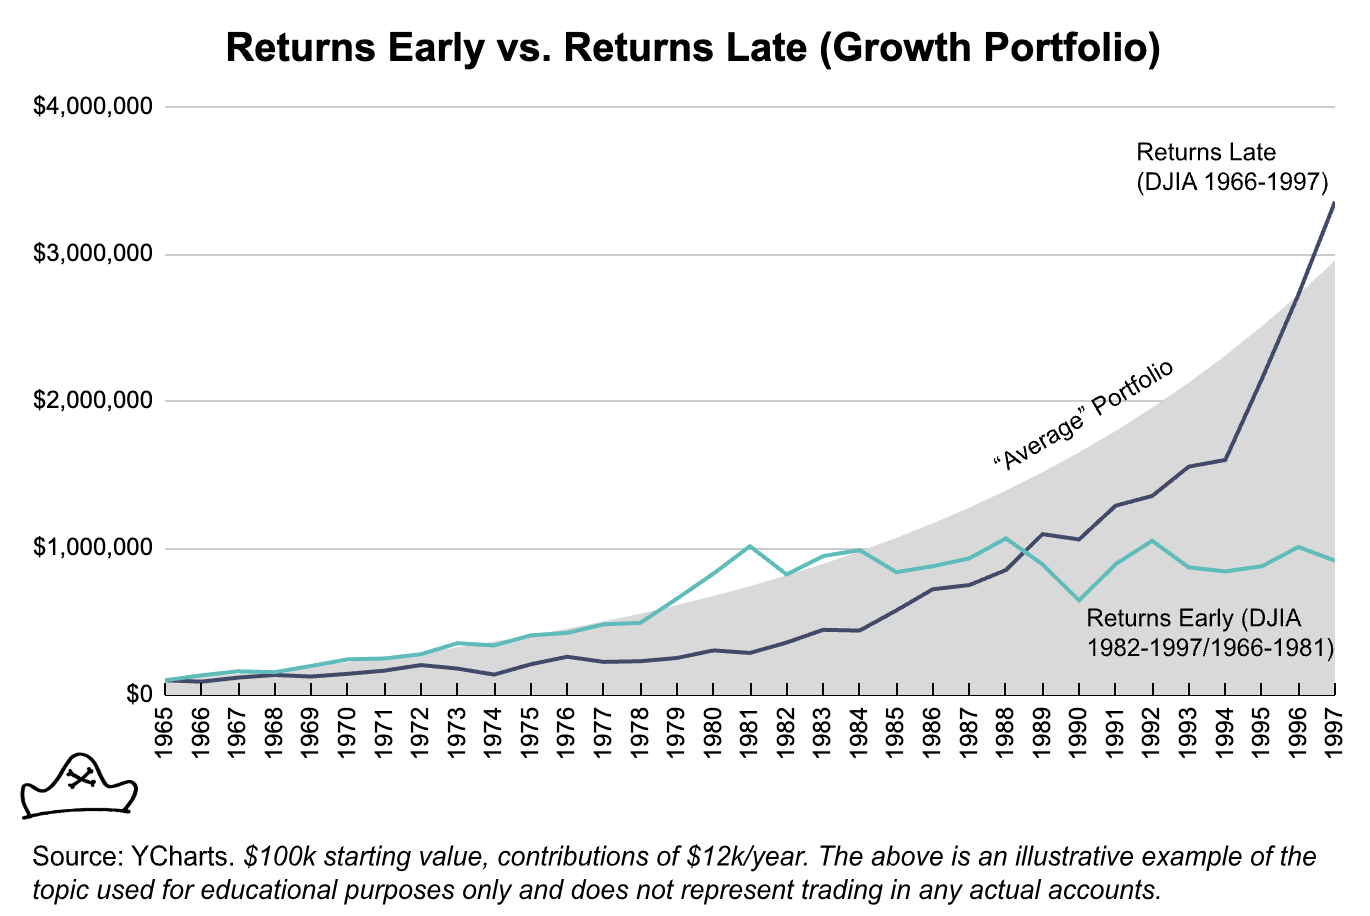
Using the 4% safe withdrawal rate, this is a difference between an annual retirement budget of $36,552.60 (returns early) and $134,230.72 (returns late). I think most people would agree that there’s a big quality of life difference between $36,000 and $134,000 a year.
The difference between these two has nothing to do with how hard working or diligent in saving one was versus the other, it’s merely timing luck.
This is worth keeping in mind for millennials and Gen X crowd that have experienced very strong post-2008 gains in equity markets. A prolonged flat period of equity returns could be extremely challenging for the equity focused investor, analogous to the 31 year old investor getting the strong period of returns early and a weak period of returns late.
Anyone with inflows or outflows to their portfolio does not get the average returns of the market. This could be someone who needed to use their savings in 1981 to buy a house, pay for their kids’ college education or start the business they’ve been thinking about for many years.
This is true in other areas of life – you can drown in a river that is 2ft deep on average! Consider a river which is 1 ft deep over 95% of its area, but contains a central channel that is 20 ft deep with a fast moving current. On average, it is ~2ft deep, but you can still drown in the main channel.
A 4% withdrawal rate can still run out of money with a portfolio that has 8% average returns over the long run. To experience ‘the long run’ you must first survive the short run. Averages can deceive when they ignore the impact of time.
What matters to me is not the average returns of the market in my lifetime, but my individual portfolio performance over the course of my own lifetimes. My investing goals are relatively simple: We want to be able to spend our money when we need it and we want it to compound efficiently over time. We think most other investors have a similarly simple goal.
But do most investor’s portfolios reflect this goal? While stock focused portfolios such as the common 60%/40% bond portfolio can through periods of significant returns, they can also struggle.
The Lost Decades of 60/40 (1968-1987)
Adjusting for inflation, the S&P Index peaked at 108.37 in 1968 and then fell 64% to 38.88 by 1982. The S&P didn’t return to its inflation-adjusted 1968 level for 24 years. Bonds did poorly too over the 1970s, which had repeated bouts of high inflation. The real returns of $1,000 invested in a 60/40 in 1968 were basically flat for two decades finishing 1987 at $1,034.
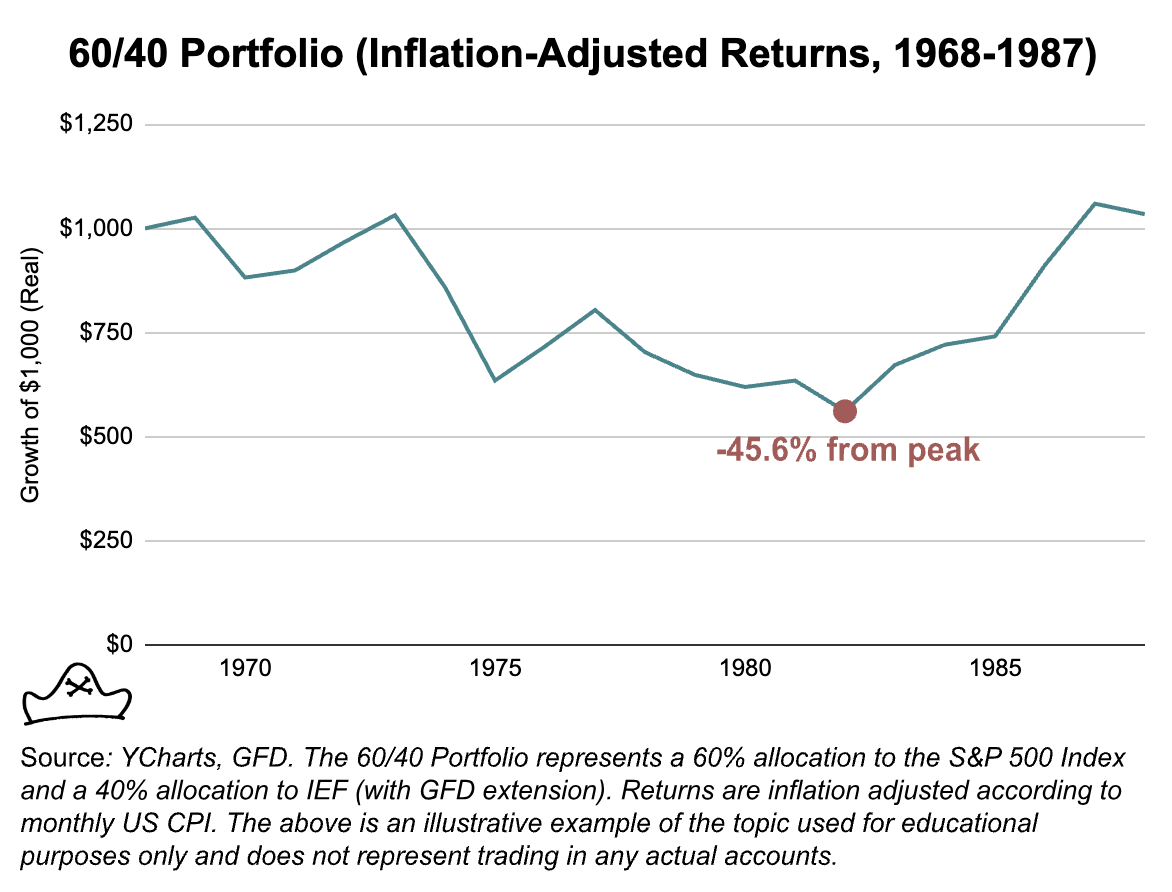
In some ways, this period would be more challenging than the 2008 GFC and COVID recessions. Both were sharp but relatively short lived. After bottoming in 2009, The S&P 500 made new all time highs in 2013. The COVID recovery was even quicker with the March 2020 lows being fully recovered by the end of the year.
Imagine yourself 20 years older than you are today and what your life will be like, what your financial needs will be. Now imagine that you have less savings than you do today. What does that imply?
When we look at the history of a 60% stock/40% bond portfolio across other geographies and a longer timeline, we see a number of instances in developed countries where these portfolios struggled or collapsed completely.
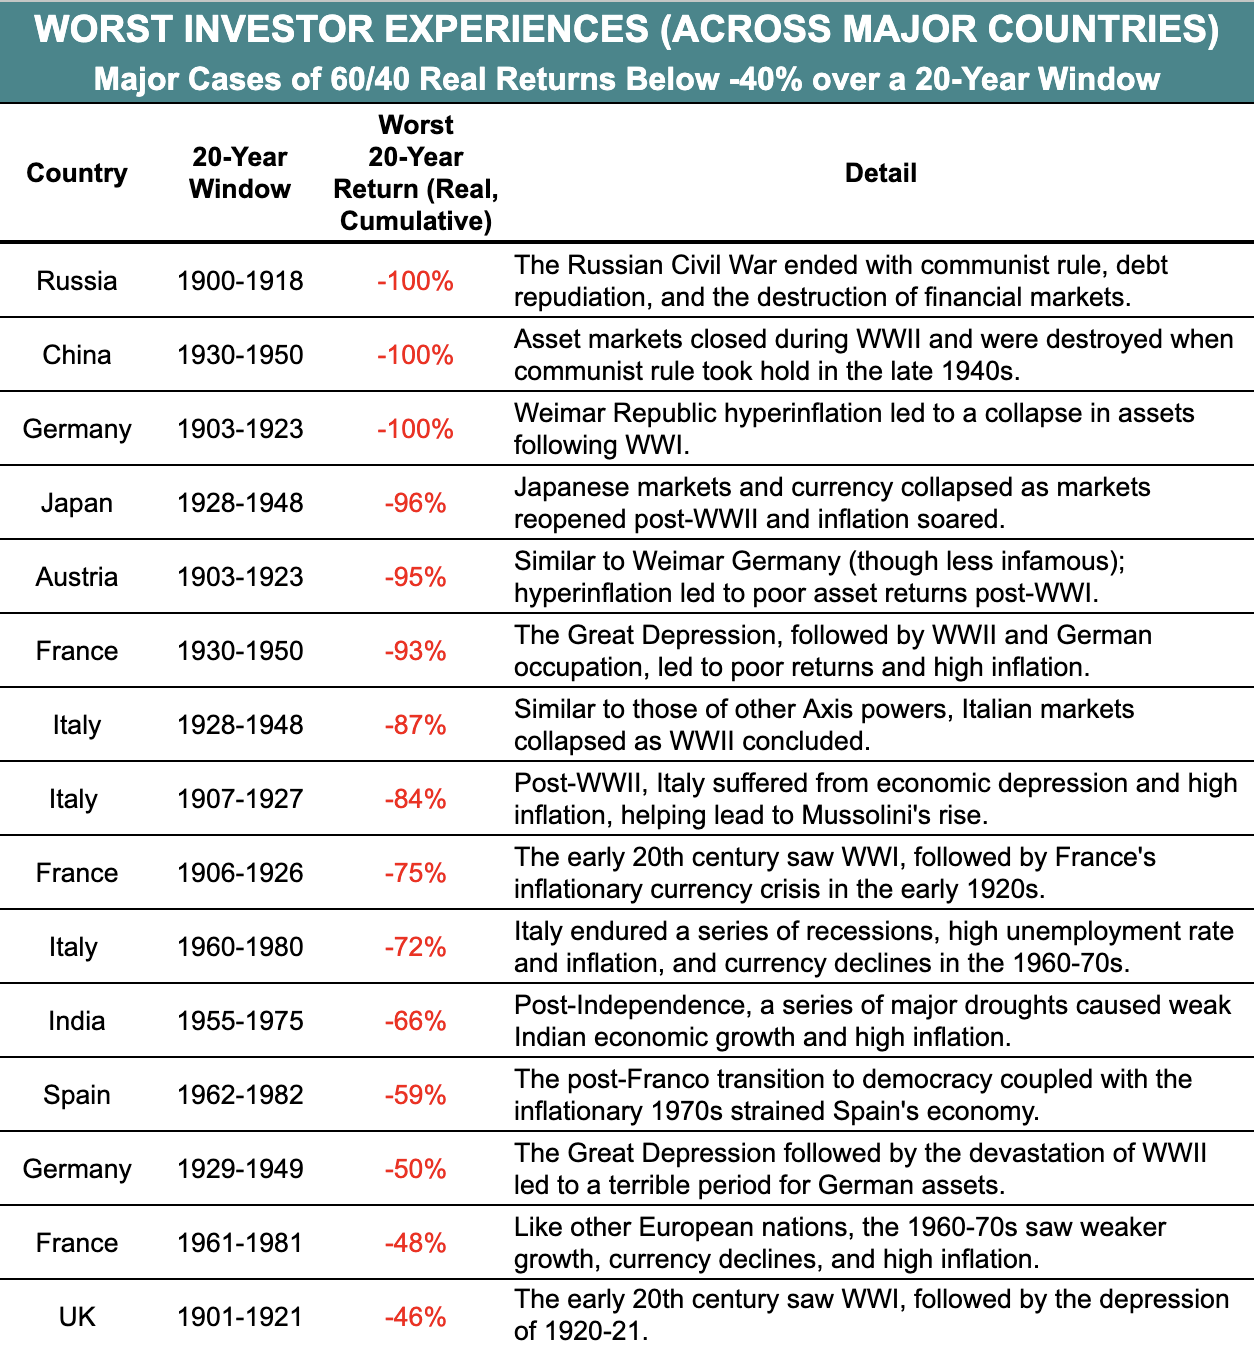
What then is the solution for investors looking to better manage the role of time in their portfolio?
Offense Wins Games but Defense Wins Championships
We believe that all financial assets can be seen as either offensive or defensive and that the combination of offense and defense allows one to compound wealth through all economic cycles most effectively.
In our experience: most investors’ portfolios are almost all offense. We group any asset that benefits from economic growth into the offensive sub-strategy. Stocks, bonds, real estate, private equity, and venture capital all fall into this category. These assets are typically correlated with economic growth.

We believe offensive assets are an important part of a well-constructed portfolio, just as a good offense is an important part of a championship team. But winning a championship requires being successful consistently over time, not just putting up a lot of points in one game. That requires a good defense. An offense that can score a lot but has a lot of variance can win big games or make big upsets but it’s hard to put together a championship team without a consistent defense.
In the 2013-2014 NFL season, the Seattle Seahawks embodied the concept of “defense wins championships.” Led by the “Legion of Boom” secondary, the Seahawks had the league’s most dominant defenses.
They had the best defense in terms of points allowed per game, holding opponents to an average of just 14.4 points per game. Their defense created 39 turnovers while their offense gave up the ball only 19 times resulting in a +20 turnover differential, which was also the best in the league.
Throughout the regular season, the Seahawks’ offense was solid, but not necessarily the highest-scoring or most explosive unit in the league. They averaged 26.1 points per game, which ranked eighth in the league.
The Seahawks faced the high-powered Denver Broncos in Super Bowl XLVIII. The Broncos offense was led by future Hall of Fame quarterback Peyton Manning. In the regular season, the Broncos averaged 37.9 points per game the highest in the league. They broke the single season record for touchdowns with a remarkable 76 touchdowns.
Despite the offensive prowess of the Broncos, the Seahawks’ defense completely overwhelmed them. They intercepted Manning twice and held the Broncos to a mere eight points in a devastating 43-8 victory.
There’s no doubt that the Broncos were a great team and Manning was a great quarterback. But they had one bad day and it cost them the championship.
In investing terms, we believe that a good defense matters for consistency over time by reducing the path risk. A good defensive portfolio component should prevent a big drawdown from happening when the offense has a bad day (or decade).
Our initial inspiration for adding defensive assets to a portfolio was from Harry Browne’s permanent portfolio. Browne was investing throughout the 1970s.
This challenging period for stocks and bonds led him to recognize the need for assets that could perform well in periods of low growth or decline as well as inflationary periods to help make up for where stocks struggled.
Looking at the tools he had available at the time, he came up with a simple portfolio:
-
- 25% in Stocks which should do well in Growth
-
- 25% in Bonds which should do well in Deflation (or declining inflation)
-
- 25% in Cash which should do well in a Recession
-
- 25% in Gold which should do well in Inflation
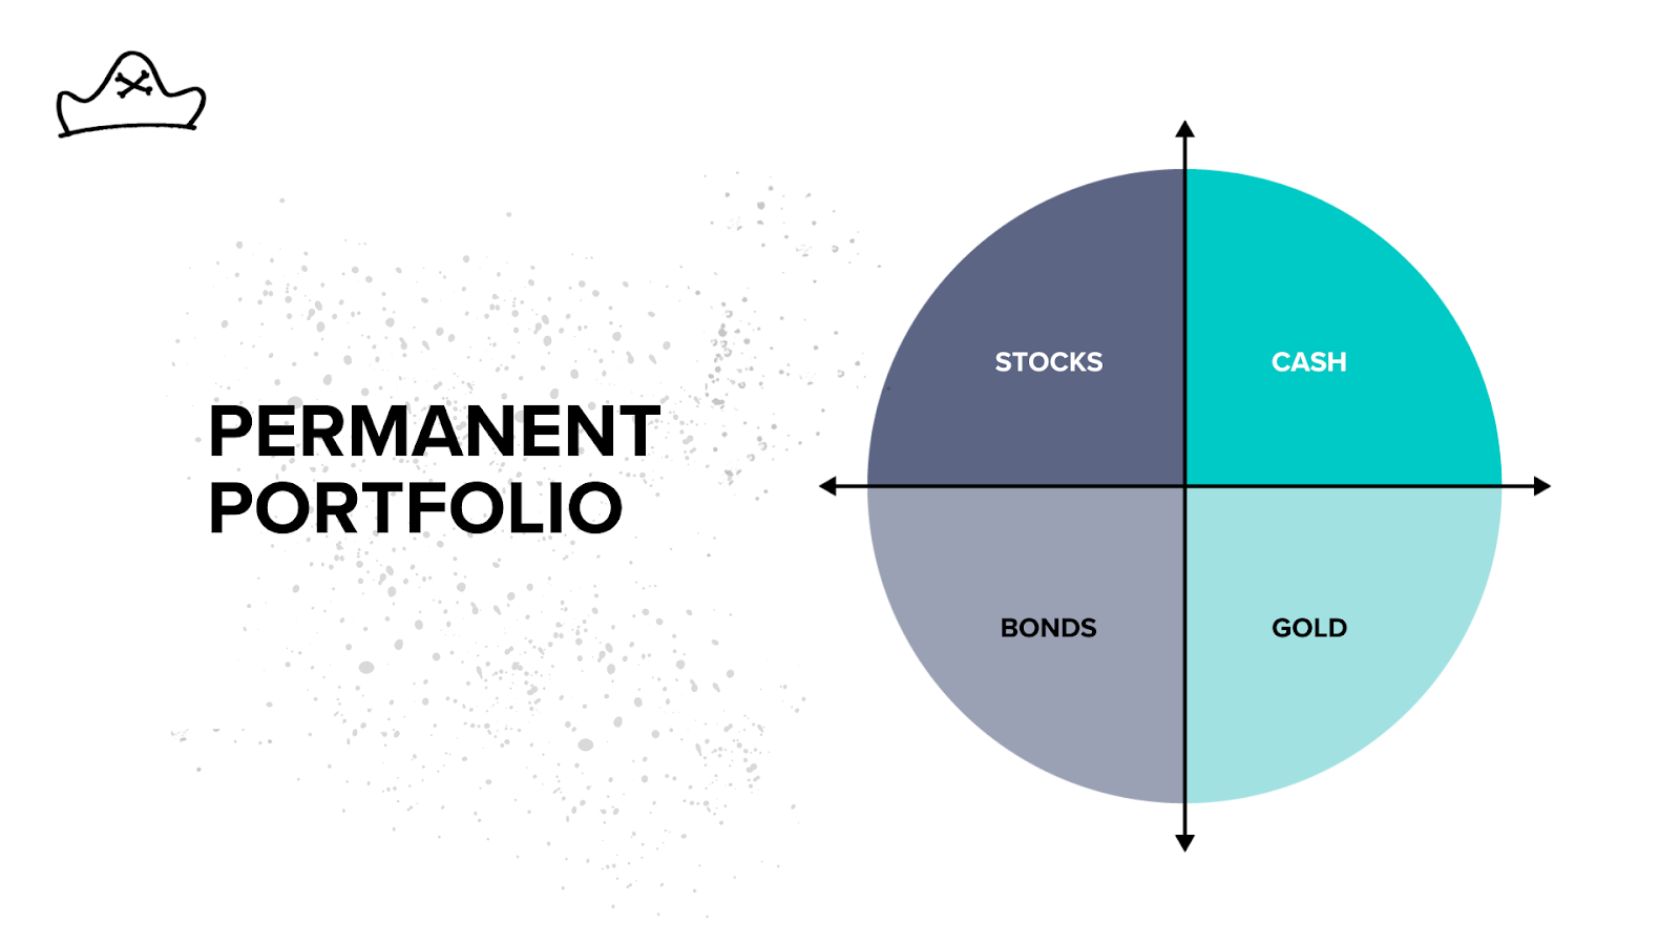
By directly addressing macroeconomic regimes other than just growth and deflation, we believe Browne made a significant improvement to the traditional 60% stock/40% bond portfolio, calling his alternative the Permanent Portfolio. Permanent, because it was designed to handle inflation, deflation, growth and recession – no matter if they show up 10 years from now or 100.
The Permanent Portfolio begins with the premise that no one is able to predict future macroeconomic regimes and strives to be prepared for whatever may come. To riff off Kurt Vonnegut, “[Financial] history is merely a list of surprises. […] It can only prepare us to be surprised yet again. Please write that down.”
The Power of the Permanent Portfolio
Because it used investments designed to perform in different macroeconomic regimes, we came to believe the Permanent Portfolio approach was a step in the right direction toward our objective of maximizing long-term wealth while letting us be confident that we and our families will have the financial resources to deal with what life throws at us.
The real magic of the Permanent Portfolio is not just how the individual asset selection covers different regimes, but how the combination behaves over time. The whole Permanent Portfolio is greater than merely the sum of its parts.
Let’s take the three principal components of the Permanent Portfolio: stocks, bonds, and gold.
Over the period from 1973 to 2022, stocks and bonds were the best returning assets and gold was the worst.
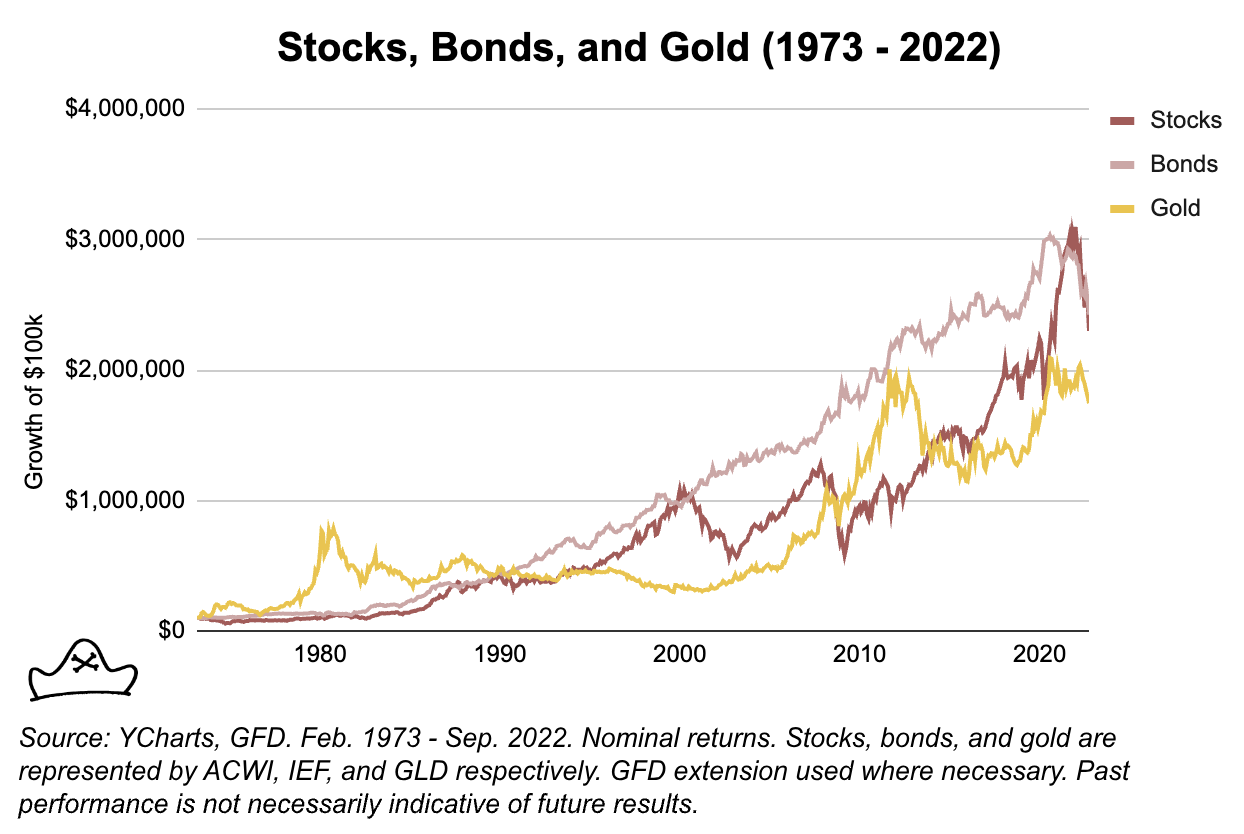

Based on this, you might think that “I want to get the best long-term performance so I should invest in bonds and maybe some stocks to diversify.”
But, what happens if we combine all three into an equally weighted portfolio and rebalance it monthly?
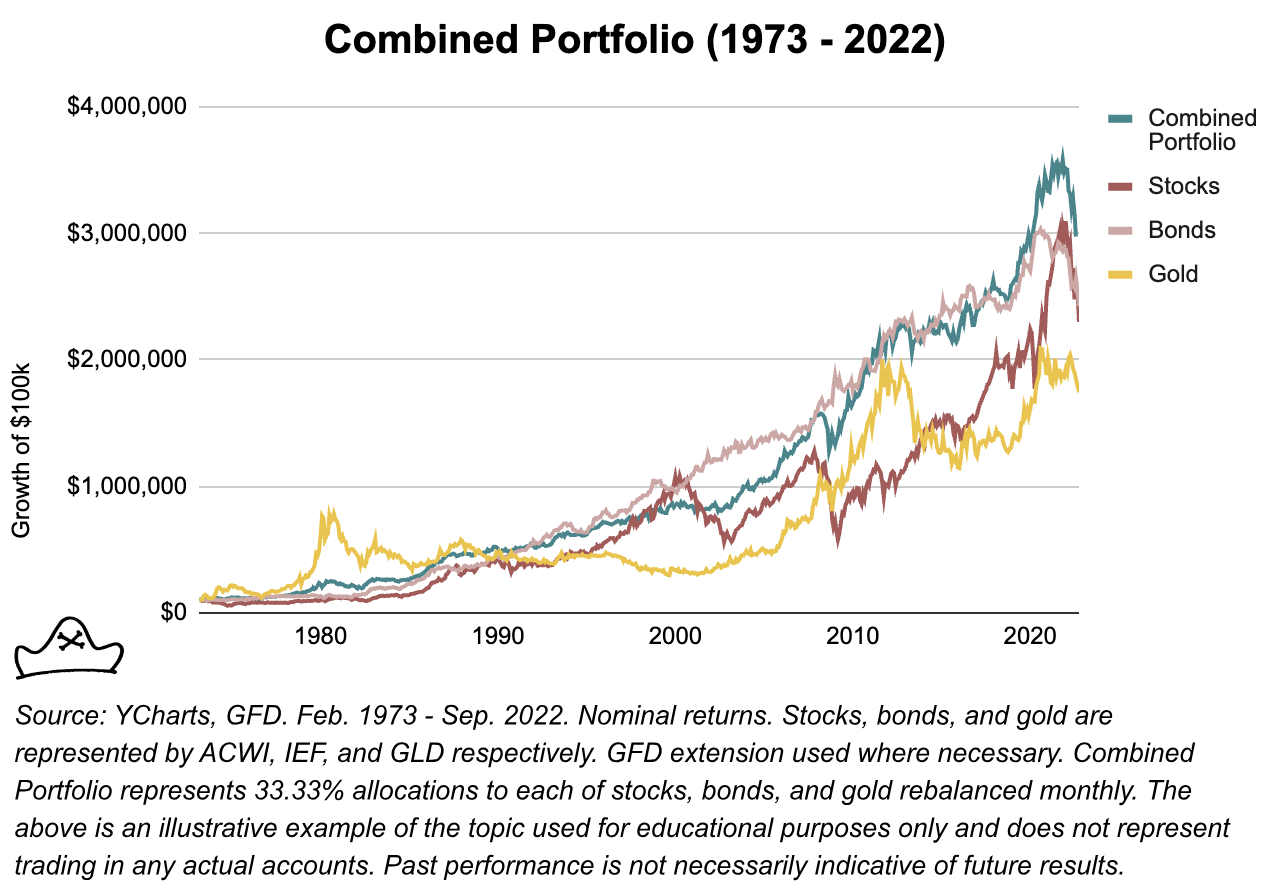

The combination of the three does something pretty cool. It performs better than any individual asset. At the same time, its maximum drawdown and volatility is pretty similar to its least risky and volatile asset (bonds).1
Even though stocks and bonds have the higher returns over this period, including gold, increases the return even though it had the lowest stand alone return of the three assets.
This is what we would hope to see out of a defensive asset. Though its stand-alone return may be lower than offensive assets, its contribution to the portfolio can boost overall performance because it performs well when offensive assets perform well. Gold’s excellent performance in the late 1970s and late 2000s came at just the right time to help offset challenging stock and bond focused periods.
Studying the Permanent Portfolio approach showed us that diversification across both offensive and defensive assets could be a better starting point than most investors use. But we wondered if it could be improved?
Improving the Permanent Portfolio
The permanent portfolio used gold and cash as its defensive components, likely because those gold was the best option that Browne had at the time for inflation protection and cash was a good way to dampen big equity drawdowns. They also had the benefit of being easily accessible for the average investor. However, we wondered if we could do better and believe two strategies in particular are promising.
Commodity Trend Following
Gold was an important contributor to the Permanent Portfolio in the inflationary period of the late 1970s. While gold performed admirably in the 1970s, its longer history is more checkered and we have not seen robust evidence that gold is an effective diversifier against mild to moderate inflation.2
The period of strongest gold returns in the last eighty years in the U.S. was the 1970s. In August 1971, US President Richard Nixon ended the direct convertibility of the US dollar to gold at $35 an ounce. He took the US and the world off the last vestiges of the gold standard. In January 1980, gold spiked to $850 when US interest rates were as high as 20%. This 2,400% gain through this period of higher inflation in the U.S. left a strong mark on investors as to the value of gold. We believe there isn’t great evidence to suggest that this will repeat in a similar period of moderate inflation as the gold standard no longer exists in any major economy.
We believe gold is an important defensive asset to act as an insurance policy against hyperinflation or outright fiat devaluation – and has done so reliably for millennia. However, we don’t think it should be relied upon for protection against mild to moderate levels of inflation.
What are the best options for strategies that do well in inflationary periods like this? One reasonable approach would be to use a basket of commodities. Since inflation is measuring an increase in the costs of goods and services which often have commodity inputs (e.g. You need wheat to bake bread and oil to make gas), then investing in a diversified basket of commodities can give a wide coverage against inflation.
A study looking at the period 1877-2015 found that commodities perform well during inflation cycles. The commodity indices studied had a return of 14.1% in high inflation periods versus -4.5% in low inflation periods.3 They found that the optimal portfolio over this period allocated 17% to commodities, 29% to stocks, and 54% to government bonds: a much larger commodity allocation and much lower stock allocation than most investors we know use today.
This performance in inflationary periods makes them a promising addition to a mostly offensive portfolio that can struggle in an extended period of inflation as stocks and bonds did in the 1970s.
However, commodities can also go through extended periods of flat or negative returns. They tend to be correlated to growth periods, with 8.9% annual returns during expansionary periods versus -7.3% during recessions. So while they have historically been an effective inflation hedge, they can be a significant drag on the portfolio at other times. It would be better if you could get commodity exposure at the ‘right’ times.
This is what a commodity trend following approach seeks to do. By focusing on a broad basket of commodities instead of just a single commodity like gold, we believe commodity trend strategies can better capture inflation wherever it shows up.
Commodity trend following is a way to try and invest more effectively in commodities like oil, gold, or wheat. The idea is pretty simple, if counterintuitive: if the price of a thing is going up, buy it. If the price is going down, sell it.
A study from Duke professor Campbell R. Harvey and colleagues provide support for the use of trend following approaches in the 8 inflationary regimes in the US between 1941 and 2008.4
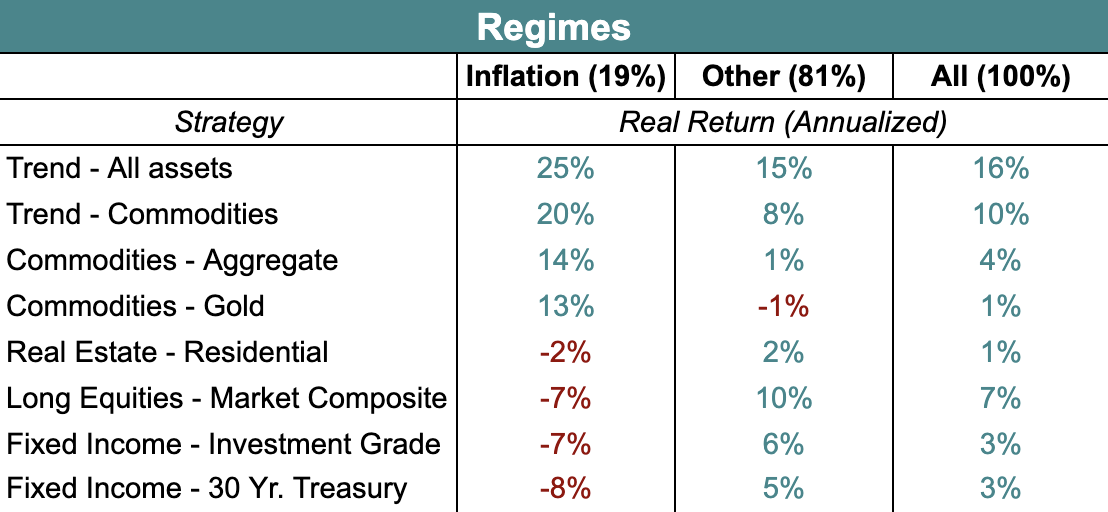
Their finding showed that offensive assets struggled during inflationary periods:
-
- Stocks tended to do poorly in inflationary regimes, with U.S. equities returning -7% annualized over the 8 inflationary regimes analyzed in their study.
-
- High-Quality Government Bonds represented by the 30-year US treasury bonds returned -8% annualized during the inflationary periods
-
- Investment Grade Corporate Bonds fared little better at -7%.
-
- Real Estate which is often touted as an inflation hedge because it’s a real asset also fared poorly, losing -2% annualized during the inflationary periods.
By contrast, the defensive assets we’ve looked at did a fair bit better:
-
- Gold fared well, though we see in the chart below that its exceptional performance over the two periods in the 1970s following the end of the gold standard played a huge role.
-
- Commodities passively held also did well in inflationary periods, returning 14% annualized over the periods studied.
-
- Commodity Trend Following performance was even better in those periods with a 20% annualized return.
Notably, Commodity Trend also performed reasonably well in the non-inflationary periods with a 10% annualized return vs. buy and hold commodity exposure returning just 4% annually.
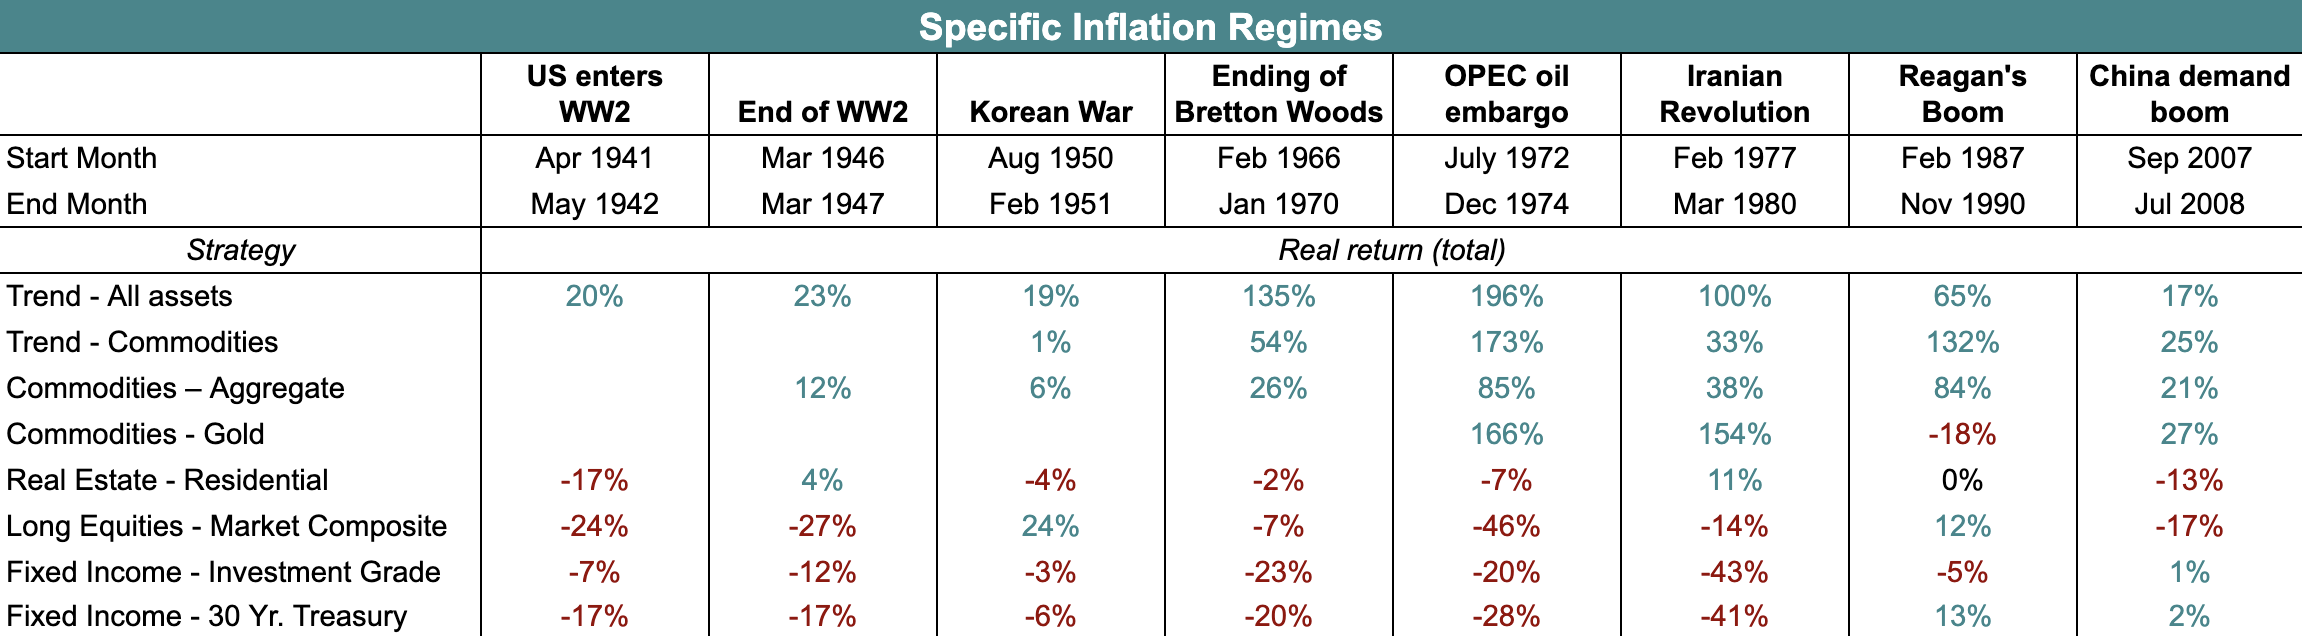
However, All Asset Trend – which includes commodities as well as stock, bonds and currencies – performed the best of these strategies both during inflationary periods. It had an annualized real return of 25% in inflationary periods and a 16% return over the entire period studied.
Importantly for our goal of providing an effective diversifier to offensive assets in an inflationary period, all asset Trend had a positive return in all 8 of the inflationary cycles studied, a more favorable performance than gold which has a real annualized return of 13% and was positive in 67% of the periods studied.5
Because of all asset trend’s stronger track record and more widespread coverage of markets, we believe it’s the most effective strategy for providing positive performance in an extended inflationary regime.
Since an all asset trend following approach is agnostic to whether prices are trending up or down, it also has the ability to perform well in deflationary periods. Commodity prices, stocks, and bonds often trend lower in deflation (1930s, 2008). Since trend-following strategies can profit from trends in either direction, it can serve as an effective defensive asset in either inflationary periods or sustained recessions.
Trend strategies can also do well during stock/bond drawdowns providing an effective ‘crisis alpha’ to offset losses elsewhere in a portfolio.
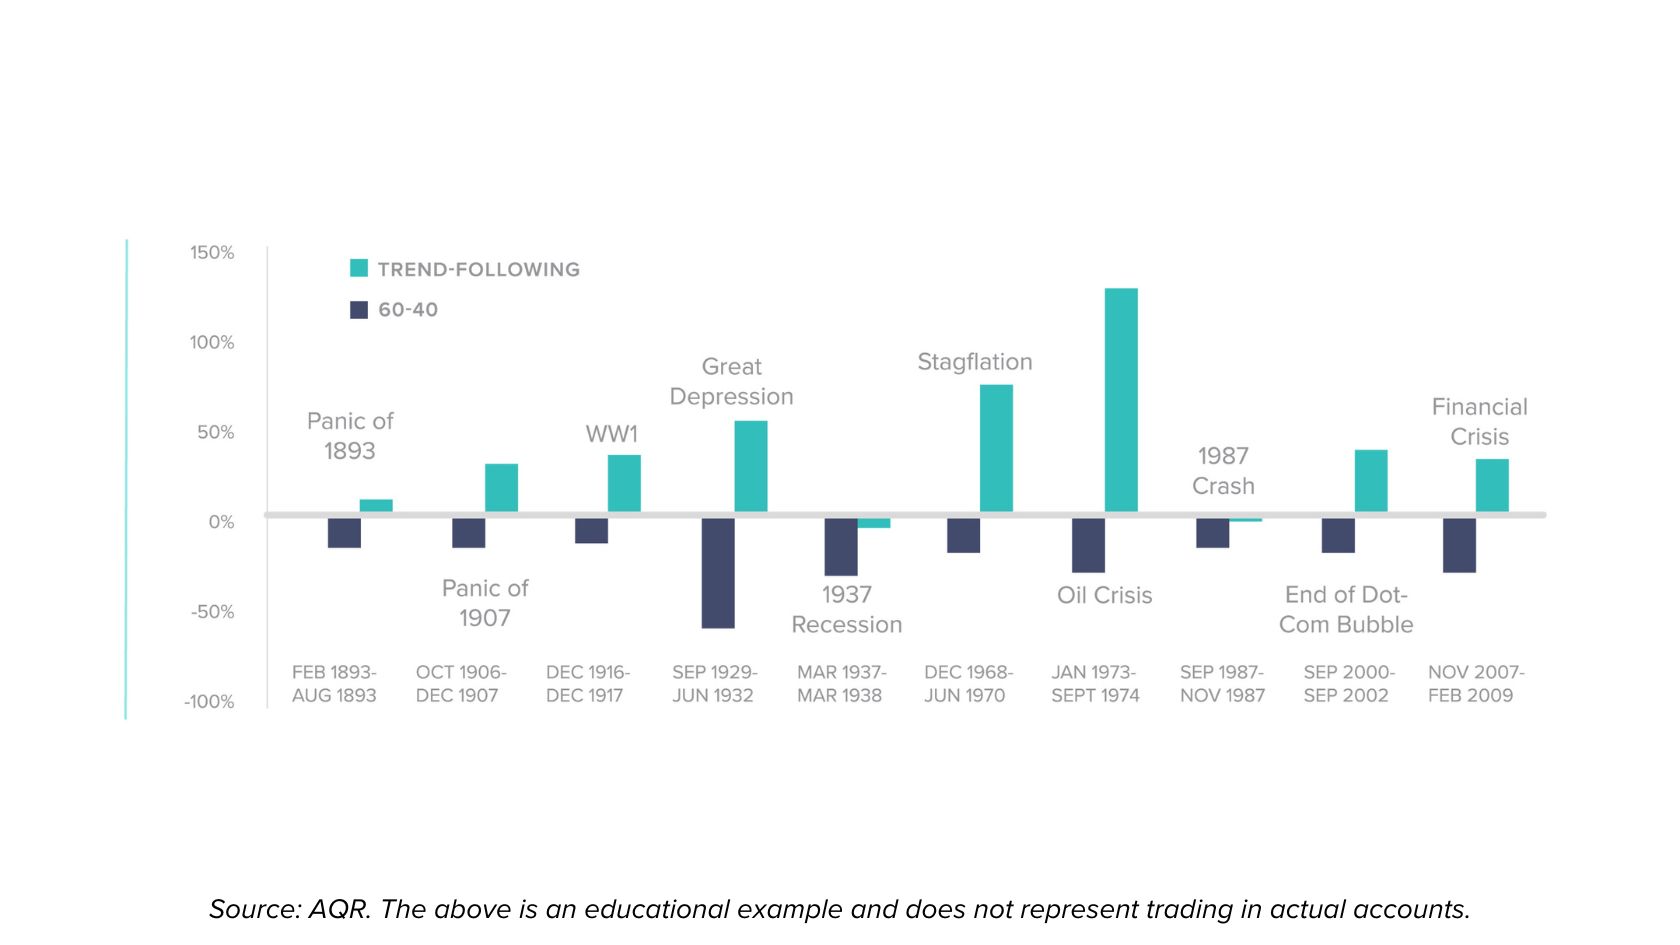
Past performance is not necessarily indicative of future results.
By replacing the gold portion of the Permanent Portfolio with a defensive trend following approach, we believed we had made a meaningful improvement. But could we do more?
Long Volatility and Tail Risk
While trend following strategies seek to profit from inflationary periods and extended recessions, long volatility and tail risk strategies seek to profit from sharp crashes and significant market turbulence like the COVID Crash in early 2020.6
We view long volatility and tail risk as an improvement on the cash quadrant of a traditional Permanent Portfolio. The primary purpose of cash or cash-equivalents in the Permanent Portfolio was to be a source of liquidity in a sharp sell-off. By having a cash position, an investor is able to purchase stocks, bonds, gold, and other assets at the time when no one else has the liquidity to do so.
In sharp sell-offs such as Black Friday in 1987, October 2008, or March 2020, almost all asset classes can sell off together as the rush for liquidity as investors need to meet margin calls or panic sets in. In the Permanent Portfolio framework, cash or cash-equivalents like short term 90-day treasury bills can be used to buy these distressed assets.
Long volatility and tail risk strategies try to improve on this ability to purchase other assets during sharp market sell-offs by generating excess returns at those times. In sharp sell-offs such as October 2008 or March 2020, long volatility strategies seek to produce their largest returns which can then be used to buy other assets at historically low prices.
Similar to other defensive assets, even though their long-return may be less than traditional offensive assets, it’s their performance during periods where offensive assets struggle that can make them additive to a portfolio.
Long volatility and tail risk strategies typically rely on options that are directly linked to the underlying indices, such as put options on the S&P 500.
A put option is conceptually similar to an insurance policy. When you buy car insurance, typically you pay the premium up front (the price of the option to have your car replaced if it gets wrecked), then you are on the hook for the deductible (the difference between the option’s strike price and current price). Beyond that, the insurance kicks in and covers any expenses. If you have a $20,000 car with an annual premium of $1,000 premium and a $1,000 deductible, then your maximum loss is capped at $2,000 – the cost of the premium plus the deductible.7
Like an insurance policy, it also typically has an expiration date. So purchasing a S&P index put option with an expiry one year from today with a strike price8 of 3,000 would give you protection beyond that price level for one year.
One benefit of options compared to other defensive assets is they are directly linked to the asset they are hedging. The structure and link between the option pricing formula and the underlying stock/stock indices is direct, rather than merely relying on historical correlations.
As a result, long volatility and tail risk strategies can be more confident that their insurance policy will pay out if the underlying index goes below the strike price. The flipside is that, like an insurance policy, if nothing ‘bad’ happens then the option is likely to decline in value and expire worthless. Just like if you don’t wreck your car in a given year, you ‘lose’ the price of the premium for that time period. For us, that’s ok – the defense doesn’t need to perform great when the offense is racking up points.
We believe combining defensive strategies with offensive strategies, investors can achieve better returns with more manageable risk. They can reduce the timing luck that Nick and Nancy or our imaginary 31 year old experienced and be more confident that their spending is there when they need it and to compound it more effectively over time.
Implementing It
Once we came to believe in the importance of defensive assets, we wanted to find a structure that non-institutional investors like us could access best-in-class defensive strategies. The challenge for many investors is that many long volatility and tail risk approaches as well as some trend options can be difficult to access in traditional ETF or Mutual Fund structures. This can limit access to institutional investors capable of investing millions of dollars into each strategy.
In late 2018, we started Mutiny Funds and we set out to solve that problem. We spent a year and a half working on a way to make this possible. We identified and spoke with dozens of long volatility managers and figured out a structure that would allow us to invest in a diversified ensemble of long volatility managers.
Initially, our plan was to raise enough from friends and family to get going, park our own money there, and leave it alone. As we spoke with more and more people, we realized that we were not the only people looking to solve this problem so we launched our Long Volatility Strategy in 2020.
In 2021, we added our flagship strategy, the Cockroach Strategy, which combines offense (stocks, bonds and a carry strategy) with defensive assets (commodity trend and long volatility) as well as offering a stand-alone Commodity Trend Strategy. We believe in the Cockroach philosophy and will continue to work on ways to improve our implementation of it.
However, we recognized over time that there are some investors who want to include defensive assets in their portfolio but also more control over the offensive portions of their portfolio.
For some people, they had large taxable gains on offensive assets so selling offensive assets came with a hefty tax bill.
For others, they wanted to take an active role through picking stocks, doing real estate deals, or making private equity and angel investments.
These investors wanted a capital efficient way to add a defensive component to their portfolios without having to make big changes to their offensive portfolios.
Enter, Stage Right, The Defense Strategy
The Defense Strategy combines Mutiny Fund’s Volatility Strategy and Commodity Trend Strategy. The Volatility Strategy is designed to act as a so-called ‘black swan’ investment, achieving asymmetric gains in times of high volatility or tail risk (e.g. March 2020). The Commodity Trend Strategy is designed to profit during inflationary periods (e.g. 2022) as well as during extended ‘crisis periods’ for stocks and bonds (e.g. 2008).
In combining these two approaches, the Defense Strategy seeks to achieve flat to slightly positive returns during high growth or low inflation periods where stock and bond portfolios perform well while providing significant returns in periods of equity market drawdowns or periods of high inflation. In effect it seeks to be a single access point for a robust defensive allocation to pair with investors’ existing offensive allocation.
If you’re interested, you can learn more about the Defense Strategy or book a time to talk with us about it here.
Combining Offense and Defense
One common objection to adding Defensive Strategies to a portfolio is that they tend to be lower total return. We saw how gold, even though a lower returning asset, could boost the overall performance of a stock/bond portfolio by providing returns when they were needed most.
Like gold in our permanent portfolio example, the Defense Strategy is not intended as a stand alone investment. It is not expected to perform well in strong years for offensive assets thought it may do so from time to time. It is intended as a diversifier to be combined with offensive assets in an investor’s portfolio such as stocks, bonds, real estate or private equity. It aims at giving investors a source of liquidity to rebalance at optimal times and achieve superior long-term returns.
For investors looking for a total portfolio solution, the Cockroach Strategy combines both offensive and defensive assets in a single strategy. While the inclusion of the Defense strategy requires active rebalancing to get the most benefits, the Cockroach Strategy is intended as a stand alone investment with a ‘set it and forget it’ approach that strives to give investors peace of mind and meaningful capital appreciation.
By having exposure to asset classes that can do well in growth, decline, inflation or deflation, the Cockroach strategy strives to have a much longer memory. It intends to systematically “buy low and sell high” as asset classes and strategies come in and out of favor in order to deliver better risk-adjusted returns over the long run.
You can learn more about the Cockroach Strategy or book a time to talk with us about it here.
Don’t Wait
We believe that now is an important time for investors to more seriously consider incorporating defensive strategies into their portfolios. Though we believe no one can predict the future, we also think that financial history suggests the decades-long period of declining interest rates and stock market appreciation is unlikely to repeat in our lifetimes.
Beginning in the early 1980s, a combination of favorable demographics (the baby boomers) and declining interest rates (falling from 19% in 1981 to nearly 0%) drove asset prices higher and higher.
Baby boomers saving for retirement meant more money flowed into stocks, bonds, and real estate, driving up prices. At the same time, interest rates were decreasing, causing individuals and companies to take on more debt, some of which was used to buy those same assets, further increasing prices.
Today, the situation looks quite different and we believe most investors are ill-prepared for this scenario. We believe that a 40-year secular boom, the majority of most living investors’ memories, has caused investors to over-allocate to offensive assets.
The bull market in stocks, bonds and real estate over the last forty years was arguably the greatest bull market in financial history. Yet, most investors treat this period as though it is the norm. To construct a portfolio that will survive over the long run, we believe it’s essential that investors identify assets that perform well when stocks and bonds don’t and make them a significant portion of their portfolio.
No one knows how this will all end. We believe the essential point is that you don’t need to know what will happen to build a portfolio that will outperform over the course of your lifetime, you just need to build a diversified portfolio that can thrive across market regimes.
Offense wins games. Defense wins Championships.
You can learn more about the Defense Strategy or book a time to talk with us about it here.
More Information
- One rebuttal is, of course, that just levering up the bonds provided even better risk-adjusted returns. A longer look back and broader look at global markets suggest that the risk-adjusted returns for ponds post 1980 was exceptionally good and would seem to me unlikely to repeat. The longer run real returns from 1926-2022 are 1.82% annualized (Source). Again, this is just a simple example to demonstrate how adding a defensive asset like gold with a lower return and relatively high volatility can enhance the overall portfolio performance.
- Erb, Claude B. and Harvey, Campbell R., The Golden Dilemma (May 4, 2013). Financial Analysts Journal, vol. 69, no. 4 (July/August 2013) 10-42., Available at SSRN: https://ssrn.com/abstract=2078535 or http://dx.doi.org/10.2139/ssrn.2078535
- Levine, Ari, Yao Hua Ooi, and Matthew Richardson. "Commodities for the Long Run." NBER Working Paper No. 22793, National Bureau of Economic Research, 2016, https://www.nber.org/system/files/working_papers/w22793/w22793.pdf.
- Neville, Henry and Draaisma, Teun and Funnell, Ben and Harvey, Campbell R. and van Hemert, Otto, The Best Strategies for Inflationary Times (May 25, 2021). Available at SSRN: https://ssrn.com/abstract=3813202 or http://dx.doi.org/10.2139/ssrn.3813202
- In gold’s defense, the fact that it was effectively pegged prior to 1971 limited the number of periods in which it could be observed. Neville, Henry and Draaisma, Teun and Funnell, Ben and Harvey, Campbell R. and van Hemert, Otto, The Best Strategies for Inflationary Times (May 25, 2021). Available at SSRN: https://ssrn.com/abstract=3813202 or http://dx.doi.org/10.2139/ssrn.3813202
- I equate long volatility and tail risk strategies here as they are sufficiently similar and tail risk is a more widely understood term. To be precise, long volatility is typically differentiated from tail risk because it forgoes continuous protection for more dynamic hedging to lower costs. Tail risk is typically more like an ‘always on’ insurance policy while long volatility tends to be and on and off insurance policy seeking to either time markets or pick specific assets to outperform a more passive tail risk approach.
- In practice, there are a gajillion clauses insurance companies use to try and avoid paying out claims, so this is simplified, but you get the point.
- The difference between the current index level (say 4,000 for the S&P) and strike price (3,000 in this example) is the equivalent of a deductible in our analogy. In this example, you could lose up to 1,000 points on the S&P but would be ‘insured’ beyond that.
