Deep Dive Questions

Helping sophisticated, long-term investors build resilient, compounding portfolios.

Mutiny Funds General DDQ

Updated: October 12, 2023

Disclaimer:
The following is designed to be informative in nature, but is not exhaustive and should not be considered apart from the full disclosures contained in the Fund’s offering memorandum. Any offer or solicitation of the Fund(s) may be made only by delivery of the Memorandum(s). There are no guarantees the strategy will perform as expected or designed, and any information described herein may change or evolve without notice. All discussions of costs relate solely to the U.S. Funds – Cockroach Fund, LLC and Long Volatility Fund, LLC. Investors into Mutiny Cayman Funds, Ltd. may be subject to other costs.

Which Strategy Should I Invest In?

The question of what you should invest in is, of course, unique to your situation. Nothing we say here can or should be considered a substitute for speaking with a financial advisor and the use of your own judgment. Having said that, we will offer a few ways of how we personally think about it.

In our opinion, the Cockroach Strategy is the best liquid total portfolio solution for those looking to maximize long-term compound growth while reducing drawdowns.

The way we look at it is that the best portfolio should perform across all major macroeconomics environments: Growth, Deflation, Decline and Inflation.

We believe that this requires roughly equal parts offense and defense.

Offensive assets would be assets such as public equities, angel, private equity, and real estate.

Defensive assets would be assets such as the Volatility Strategy, gold, commodity trend strategies, and cash.

The Cockroach Strategy seeks to provide exposure to a diversified ensemble of offense and defensive assets in a liquid portfolio.

The Firm Uses CME Bitcoin and Ethereum Futures, Not Cash Crypto.

In our view, Mutiny Funds’ other offerings including the Defense Strategy, Volatility Strategy, Volatility+Stocks Strategy, and Trend Strategy are best used as tools for investors which want to customize other parts of their portfolios within the Cockroach framework.

For instance, an investor that focuses on stock selection and wants discretion over the stock portion of their portfolio could do so as they see fit and use the Volatility Strategy and Trend Strategy to complement it and provide their defensive exposure.

Similarly, an investor focused on income from Real Estate may want to manage the Income component themselves through their real estate holding and could use the Volatility+Stocks Strategy as well as the Trend Strategy to round out the portfolio.

Of course, you may have differing views on what the appropriate portfolio construction is for your situation and should allocate using your own judgment.

In the Cockroach Strategy, we will automatically rebalance the assets each month. For investors wishing to implement themselves, we believe they must rebalance regularly to achieve the best results. This means adding to the strategies when they are losing money as well as redeeming when they are performing well.

If you are investing through a retirement account, the rebalancing can be difficult to do since sometimes new funds cannot be transferred in when you would like to and so the Volatility+Stocks Strategy or Cockroach Total Portfolio Strategy may be more appropriate as the rebalancing is done “in house.”

When Should I Invest?

We don’t believe in trying to time our exposures. For instance, Calpers missed a billion dollar payday in March 2020 when they redeemed their tail risk exposure just months before. Our philosophy is that investors should focus on building a balanced portfolio rather than trying to time macroeconomic trends.

Rather than engaging in market timing, we believe it is important to remember that the Volatility Strategy, Trend Strategy or any other component of the Cockroach Portfolio should be seen as part of a broader portfolio and viewed holistically.

There will be periods where Mutiny Funds’ Volatility Strategy or any long volatility strategy underperforms short volatility strategies and/or outright loses money. Similarly, there will be periods where Mutiny Funds’ Commodity Trend Strategy underperforms or suffers losses. However, what matters is how it is performing its role in the portfolio. If a long volatility strategy is struggling while the rest of the portfolio is doing well, that’s nothing to be unhappy about – indeed that is part of its role.

We strongly believe that the combination of long and short volatility strategies will produce the best risk-adjusted returns over the long run of a lifetime, a form of True Diversification.

What Counterparty Risks are There?

The principal sources of counterparty risk would be our bank, outside funds we are invested in, our futures brokers, and our securities brokers.

Mutiny Funds main bank is CIBC Bank USA, whose parent CIBC is the 11th largest bank in North America.

Funds are also held at StoneX, ADM, and Wedbush, the Futures Clearing Merchants (FCMs) which facilitate futures trading, who in turn hold assets not being posted to the exchanges at top tier banks such as BMO.

The funds held primarily at our FCMs are held as a so-called “performance bond”, effectively margin, against futures and options positions purchased and sold by the fund.

Per regulatory requirements, the money is held in StoneX’s customer segregated account, meaning it is for the benefit of the firms’ customers only, and not commingled with the firm’s capital or rehypothecated as happens in a fractional reserve system. Additionally, StoneX, our primary FCM, has National Futures Association (NFA) reporting requirements and is a publicly traded company that has all the scrutiny which goes along with being public.

The way that the Futures industry works is that only members of exchanges like the CME Group can transact with one another, and only after posting a “Performance Bond” to the exchange. Here’s the Chicago Mercantile Exchange’s explanation:

Performance Bonds, also known as margins, are deposits held at CME Clearing to ensure that clearing members can meet their obligations to their customers and to CME Clearing. Performance bond requirements vary by product and market volatility.

This protects against counterparty risk, with each trade having to be ‘pre-funded’ with the margin amount, and CME Clearing acting as the buyer for every seller and vice versa on every trade. They guarantee the other side of the trade by holding the performance bonds of each party to the trade.

Further, the exchanges have a ‘guaranty fund’ which is in place in case a clearing member loses more in a day than they had on deposit with the exchange and are not able to meet the ‘margin call’ for more money. As of March 31, 2023, The CME’s guaranty fund is $4,804,588,702. They have an additional $13 Billion ($13,212,618,930) in assessment powers where they can require the members (primarily Futures Clearing Merchants such as StoneX) to cover any shortfall in the guaranty fund. (Please see the CME Website for an up to date number)

Additionally, everything is marked to market every day, meaning the clearing members who had positions that lost money that day need to settle with the exchange against those who made money that day, with billions moving back and forth between the clearing members and the exchange each day to ‘clear’ and ‘settle’ these trades, even before the trade is officially closed out.

For instance, if a trader has a position move against them, then they are required to post additional margin if they wish to continue trading so that their counterparty knows they will be paid out in full.

Finally, not everyone who uses futures is a member of the clearing exchanges. The FCM’s solve this issue, with them owning the expensive membership, posting the margin requirements, and taking on the counterparty risk. The end customers, such as the Fund, use the FCM’s membership in exchange for a commission on each trade.

As noted above, when an FCM accepts customer money, that money must be held in a segregated account and only used to post margin to the exchange and settle trades between the FCM’s customers and other FCMs. The FCMs hold the entirety of their customer’s cash in this manner and are regulated so that the money isn’t rehypothecated or levered up. The FCMs also add their own capital to this customer pool, called excess capital, to act as a buffer against any one customer being unable to cover losses in their account.

In 2008 when the equity space saw a large amount of counterparty risk realized with firms such as Lehman going under, the Futures and Options space functioned as designed, without major disruptions to the workings of those markets or counterparties.

We specifically built our funds in the futures space because of the transparency, liquidity, and control present there via the centralized exchange model, in addition to layers of risk monitoring by introducing brokers and FCMs noted above. If you’d like to learn more about how Futures work, we believe this Khan Academy course provides a helpful introduction.

The intention is that the majority of our funds are held at either the bank or FCM as described above. However, we also have some funds at securities brokers for managers that trade securities and we have some 3rd party funds which have different counterparty risks. Our intention is to always limit this exposure, but we believe that, appropriately limited, it offers some additional diversification that improves the overall portfolio.

Additionally, we use 3rd party administrators for all our funds and auditors to try and eliminate any single point of failure.

What is the Liability Situation For Each of The Funds?

Investors in the Fund(s) are provided all the liability protections of a Delaware Limited Liability Company.

This means a Member cannot be individually subjected to margin calls and cannot lose more than the amount of such Member’s original investment and any profits earned thereon (which have not already been withdrawn).

What are the Other Risks and How Do You Think About Them?

If you want to move forward with an investment, you will see a full list of risks associated with the fund in the Private Placement Memorandum (PPM). The PPM is available upon request or will be supplied upon submission of our investor information form to proceed with an investment.

In addition to the counterparty risk controls highlighted above, we would note the following two risk control measures:

As much as possible, we use Separately Managed Accounts (SMAs) with most of our sub-advisors. Unlike investing in a fund, theser allow us to see their trading intraday and to put contract size limits that they are not allowed to exceed with the Futures Clearing Merchant (FCM).

Beyond the rebalancing benefits of diversification, we also use it to limit risk to any one manager with appropriate position sizing. Our ensemble approach to sub-advisors, strategies, and market micro structures seeks to mitigate the primary risks associated with any one sub-advisor or trading strategy.

What Compliance Policies are in Place?

The Co-managers have the following policies and procedures in place:

  • AML Policy
  • Additional Risk Disclosures
  • Material Conflicts of Interest Policy
  • Customer Complaints Policy
  • Disaster Recovery Plan
  • Discretionary Account Procedures
  • Do Not Call Policy
  • Electronic Mail Policy
  • Ethics Training Policy
  • Information Systems and Cyber Security Policy
  • NFA Self Examination Policy
  • Opt Out Notice
  • Privacy Policy
  • Promotional Material and Supervisory Procedures
  • Sales Practice Policy

All policies are available for review upon request.

When are the Fees Paid: Monthly? Quarterly?

Management fees for all strategies of all funds are 1% of assets under management per year.

The management fee is assessed monthly (1/12 of 1% each month).

Incentive fees crystallize and are paid quarterly and are specific to each strategy.

Please note that nothing said in this document constitutes tax advice and you should consult with a tax professional.

What is the Tax Situation For U.S. Investors?

For U.S. based investors, the majority (we estimate ~70%) of our trading for all Strategies is in futures markets and certain option trades which are considered Section 1256 contracts.

Under the U.S. tax code, Section 1256 contracts get special treatment where the total gain is treated as being 60% long-term capital gains and 40% short-term capital gains.

This is regardless of if the holding period is one minute or one year. Since many of our holdings (especially in the Volatility Strategy) are being actively traded with average holding periods of a few hours or days, this is advantageous to us, giving us a blended rate below the short-term capital gains rate.

Depending upon our managers strategies, it is possible that a portion may also take place in equities at the standard equity tax rates for short and long-term capital gains.

One primary difference between Mutiny and a mutual fund, ETF or stock is the 60% long-term capital gains and 40% short-term capital gains treatment as noted above.

The other primary difference is that it is marked-to-market (vs a mutual fund or stock which only has tax triggered at time of sale) so that taxes will be owed each year.

For example, an investor investing $1mm that then sees their investment appreciate to $1.1mm over the course of a year will owe tax on the $100,000 profit. As tax rates vary materially from state to state and based on personal circumstances, we leave it to the investor to do the ultimate calculation.

The Fund does not anticipate that it will make current distributions. Accordingly, each Member should have alternative sources from which to pay its U.S. federal income tax liability or be prepared to withdraw the needed amounts from the Fund.

If you have a self-directed IRA or solo 401k, we are able to take investments through a self-directed IRA custodian. This should have all the tax-deferral benefits of an IRA investment and so may make more sense depending on your individual situation. If you would like help setting up a self-directed IRA, please contact us

For investors whom it affects, we do not expect to incur any UBTI.

When Will US Fund Investors Receive Tax Documents and How Does the Process Work?

Investors will receive an audited annual report with financial statements, detailing the activity and financials for the overall Fund in which they are invested.

Investors will also receive a K-1 reporting their share of the prior year’s profits and losses for the Fund in which they invest. Here is an explanation of how K-1s work in a fund structure if you are not familiar.

Because our funds are invested in other funds, we have to wait until we receive final audited financial statements from those funds to compile the audited annual report and K-1. Those outside funds are not required to submit their audited financial statements with the regulators until March 31. We usually receive most of them around that time though it is typical for at least one or two of our managers to file an extension.

Once we have received the audited financial statements and K-1s from the other funds, we will work with our third party administrator, to put together the annual financial statement for Mutiny Funds, and then turn them over to our auditor and tax preparer, Cohen & Co., to perform their certified audit of the financials.

Once the audit has been completed, the annual report will be filed with the National Futures Association (NFA) and you will receive a copy. Typically this will be the end of June.

At the same time, the Cohen & Co. tax department will use the prior year’s financial statements to prepare the fund’s overall tax return and each investor’s individual K-1s. These will be sent out to you as soon as we receive them.

We will do everything in our power to get investors the K-1s promptly, but owing to the fact that we cannot begin our own process until we receive everything from our managers it is unlikely we will be able to send them out before June at the earliest. Based on prior years, investors should expect K-1s in August which would require filing an extension.

As a matter of practice, we will file an extension for Mutiny’s overall tax return, given the need to wait for the third party fund’s K-1s.

Do you have an Offshore Vehicle?

Yes, we have a Cayman Fund vehicle, the Mutiny Cayman Fund, Ltd. which acts as a feeder fund into our U.S. based funds.

What is the Difference Between the Cayman Fund and US Funds?

The Cayman Fund is intended exclusively for non-US persons. The primary difference between the Funds is their registrations, tax jurisdictions and allowable investors.

The Cayman Fund is registered with the Cayman Islands Monetary Authority (CIMA) and submitted its offering docs to them prior to launch, versus the US funds which do so with the National Futures Association.

The Cayman Fund is not under US tax jurisdiction and thus does not file a partnership return with the US government as the US Fund does. Finally, the Cayman Fund allows non-US investors to choose which of Mutiny’s investment strategies they wish to invest in, at which point that money is invested by the Cayman Fund into the applicable US Fund: Long Volatility Fund for our Volatility, Volatility + Stocks, and 2.5x strategies and Cockroach Fund for our Cockroach and Commodity Trend strategies.

The Cayman Fund is only available to non-US persons or entities with US persons as beneficial owners. That means:

  • You are not a U.S. citizen;
  • You do not have a U.S. permanent resident visa (“green card” in common parlance);
  • You do not spend “too many days” in the United States every year; and
  • You have not made a special election to be taxed as a U.S. resident.

If you are a non-US person or entity, it is our understanding that Cayman fund investors would not be subject to U.S. estate taxes as they are not investing into a US entity whereas individual investors into the US Funds would be subject to the US estate tax. Investors into the Cayman Fund are also not required to fill out a W-8BEN.

In regards to tax jurisdictions, please note that we are not tax advisors and none of this is tax advice and you should consult with a tax expert to determine the most appropriate course of action.

If you’d like to consult with your tax advisor, the info you likely want to pass on is that our US funds are structured as US LLCs (Delaware LLCs), taxed as a partnership and investors will receive a K-1 showing their share of partnership income/expenses each year. The Mutiny Cayman Fund, Ltd. is an exempted company under the Cayman Mutual Fund Act.

Please note that there is a slight increase in the effective fee level on the Cayman Fund since investors in it are paying the same fees as the investors into the U.S. fund plus the operational expenses of the Cayman Fund (e.g. cost of Cayman based audit and directors).

Can Offshore Investors Invest in the U.S. Fund?

We do accept certain non-US investors into our U.S. Funds, pending a few requirements.

We have non-US investors sign a W-8BEN which is essentially the investor representing that they are under a different non-US tax jurisdiction and will report their profit/loss to their local tax authority.

We also have non-US investors sign a side letter waiving their right to any US based income in the form of FDAP income (dividends or interest) which would trigger a withholding requirement by the fund. The funds are not designed to produce any such income, and as such we believe it will be a de minimis amount, if ever realized. This side letter attempts to prevent non-US investors from needing to file any U.S. tax forms such as the 1042 withholding form for any de minimis income. Interest from T-bills shouldn’t generate FDAP or ECI income for non-US investors.

We are unable to comment on the tax situation with specific countries as it’s outside our scope of expertise. If you’d like to consult with your tax advisor, the info you likely want to pass on is that both funds are structured as US companies (Delaware LLCs) and investors will receive a K-1 showing their share of partnership income/expenses each year.

Non-U.S. residents could also be subject to the U.S. estate tax. This applies only if an investor should pass away while invested in the fund as an individual. Investments via an entity are typically not subject to the estate tax as the entity does not pass away. One option if you are investing as an individual is to get a life insurance policy that would cover any taxes owed which is typically fairly affordable (depending on one’s age).

Non-U.S. investors will also need to sign a form that explains how you found out about us and confirms we did not actively solicit your investment in your home country.

Of course, nothing we say here is or should be considered tax advice.

Addendum: If you are a non-US person but have a Social Security Number or US Tax ID (e.g. if you were a U.S. resident at some point), please notify us of this prior to investing so we can accommodate your situation appropriately.

What is the Process for Investing If I Decide to Do So?

If you move forward with an investment, the subscription process should take about 15-20 minutes.

The steps are:

  1. Submit your information (est. 10 minutes) – To make the process smoother for you, we can pre-populate your subscription agreement to make the process smoother. In order to put your docs together, we will need you to complete our investor information form. If you prefer to do it yourself, let us know and we can send you the blank subscription agreement for you to fill out.

    Filling out the form is not binding. We will not consider your subscription active nor ask you to wire funds until you have received, reviewed and signed off on the offering memorandum.

  2. (For US Investors) Verify your accreditation (est. 5 minutes) – If you list a CPA, Lawyer or Financial Advisor in the investor information form, we will automatically email them on your behalf. If you do not have anyone that can verify your accreditation then we are able to accept accreditation from services Accredd and Parallel Markets. Non-US persons do not need to go through this process.

  3. We Pre-Populate Your Subscription Agreement – Once we’ve received your investor information form, we will pre-populate your subscription documents and send them to you for electronic signature along with the appropriate tax documents (W9 for U.S. investors or W-8BEN for non-U.S. investors).

  4. Review and Sign the Investment Documents – Review your pre-populated subscription agreement to confirm and sign.

  5. We get 3rd Party Administrator Approval (We do it) – Once you have had time to review the documents and sign them, we will countersign them and send them to our third party administrator for their approval. If necessary, the administrator may contact you directly asking for follow up information or documentation.

  6. Wire in Funds (5 minutes) – Once the administrator has confirmed that everything is in order, you will receive instructions to send either a wire or a check to our account at CIBC Bank for the amount of your subscription.
What are the Deadlines for Making a New Investment in a Given Month?

In order to make sure all investors receive a smooth onboarding experience, our deadlines for investment are:

Finalized Subscription Documents are due 8 business days prior to the end of the month at 11:59pm ET/8:59pm PT. This includes acknowledgements of receipt of PPM and OA, signed Subscription Agreement, photo identification, tax form, accredited investor letter, and any corporate/entity/trust related documentation (if applicable).

Any completed subscription agreements received later than 8 business days prior to the end of the month will be assigned to the subsequent month. (For example, if we do not receive final docs until June 22nd, the investment will be active as of August 1. If all completed docs are received by June 21st, your investment will go active July 1st assuming the wire also arrives in time).

If you submit our investor information form by the 10th of the month, we anticipate you will have plenty of time to get your accreditation verified (for US investors only) and supply other documents should they be needed. If information is submitted just before the deadline then it is likely that your investment will be assigned to the following month though we will do our best to include it.

Subscription funds (e.g. a wire transfer) must be received no later than 5 business days prior to the end of the month by 4:30pm ET/1:30pm PT in order to be active at the start of the following month.

Can I Invest Through My Existing Custodian Or Brokerage (E.G. Schwab, Fidelity, TD Ameritrade, Interactive Brokers, Etc.)?

We are able to accommodate clients of Registered Investment Advisors (RIAs) that use Schwab, Fidelity and TD Ameritrade through their RIA platforms.

We would love to be able to facilitate this for all investors. Unfortunately the major custodians and brokers we have spoken with do not enable investments into private funds.

The investment process would just require you to complete our subscription documents and send a wire from one of your existing accounts. Upon redemption, funds would be wired back to your account. You would be able to track the performance of the fund via monthly statements.

Are You Able to Accept IRAs?

Yes, we are able to accept investments via Individual Retirement Accounts (IRAs), but most commonly those assets will need to be outside of a corporate plan and set up as a self-directed IRA (sometimes called checkbook IRAs). Midland Trust is the firm we most frequently work with and they charge a flat annual fee (around $325 at time of writing) for funds under their custody.

Millenium and Kingdom Trust are the other firms we’ve worked with, though we are able to get set up with any self-directed IRA provider that you prefer.

One important difference between Mutiny and a mutual fund, ETF or stock is that it is marked-to-market (vs a mutual fund or stock which only has tax triggered at time of sale) so that taxes will be owed each year.

For example, an investor investing $1mm that then sees their investment appreciate to $1.1mm over the course of a year will owe tax on the $100,000 profit. Because of this, investments via an IRA account may be more tax advantageous for investors.

Please note that due to transfer times outside our control, it typically takes ten days (and can take up to 3 weeks) from the time you start setting up a self-directed IRA to when you are able to fund your account. Our IRA Onboarding document has more details on the process and timelines of getting set up.

In order to make sure all investors set up a self-directed IRA in time for a following month investment, our recommendations are:

  • Setting up a self-directed IRA and funding by wire: +/ – 9 days. Process to be initiated by the 15th of the month.
  • Requesting a Transfer from another IRA (e.g. eTrade, Schwab, Fidelity) with funds available in cash: +/ – 9 days. Process to be initiated by the 15th of the month.
  • Setting up a self-directed IRA and funding by check: +/ – 14 days. Process to be initiated by the 10th of the month.
  • Requesting a Transfer, funds are not in an IRA and need to be rolled over from an employer plan. +/ – 21 days Process to be initiated by the 4th of the month.
Are You Able to Accept 401ks?

We are not able to accept 401k plans provided through a company as it triggers ERISA regulations which we do not operate under.

We can take Solo 401ks if they are self-directed and not an ‘ERISA Plan”. The process would be the same as explained above in “Are you able to accept IRAs?” where you would need to choose a self-directed custodian and move your self-directed 401k account to them.

What Are the Liquidity Terms? How Quickly Can I Redeem or Add Funds?

In the normal course of business, we are able to offer monthly liquidity. That means that if we get 8 business days’ notice before the end of the month, we are able to send the majority of your funds the following month.

Typically, you will receive 90% of your funds back by the 15th of the following month.

For example, any request made before the March cut off (circa March 22nd) the ~90% wire would go out by April 15th. We do reserve the right to hold up to 10% of your investment until the next calendar year to finalize the audit and prevent any unnecessary back and forth, though this is not typical and we aim to finalize the full redemption within 30 days.

As a remnant of the financial crisis and people reading about gates and hedge fund lockups, some people worry about the impact of redemptions on other investors in the Fund.

In general, we are trading highly liquid markets and so do not anticipate any situation in which one investor redeeming would materially affect other investors.

Given the types of strategies our managers are trading and the situations in which they would be required, we have never had an issue and do not anticipate this to be an issue.

If you are investing via a self-directed IRA custodian like Midland or Millenium, all redemption requests should be directed to Mutiny instead of an IRA in order to prevent delays.

How to Add and Redeem Funds

To add or redeem funds, please complete our change form.

In order to accept additional funds or new investments, we need to receive the wires with funding five (5) business days before the month to make sure we are able to deploy the funds to our managers in a timely manner so we ask that you submit the change form no later than eight (8) business days before the end of the month.

Forms received later than eight (8) business days before the end of the month and wires received later than five (5) days before the end of the month will be held for allocation the subsequent month. (e.g. If the wire is received May 29, it will be invested July 1 rather than June 1 as it was not received 5 business days prior to June 1).

If you are redeeming funds, please note there are two parts to the process:

First, your investment will be reduced/end as of the last day of the month the request is made (assuming it is done before the 8 business day cut off date). For example, if you request a redemption on May 15th, your investment will be liquidated by the amount requested on the last trading day of May.

Second, the 3rd party administrator has to calculate the monthly performance and finalize the accounting for that month before we are able to send the full amount of your redemption.

Because we need all of our managers to finalize their accounting before we can finalize ours, this is unlikely to be completed before the 20th of the month and usually happens around the 25th-30th. Given this, our standard practice is to wire out 90% of your estimated capital account amount around the 10th-15th wires of the month. The remaining 10% of funds would go out after accounting is finalized, usually around the end of the month. In our example here of a request made on May 15th, the first wire would go out around June 10th-15th with 90% of the value. The second wire would go out around June 30th with the remaining balance.

Please be advised that this means any redemption request received inside of eight (8) business days prior to the end of the month (say May 29th) would mean your investment would remain active through the end of the following month (June 30), and the withdrawal redemption amount would be wired out the month after that (July in our example).

When Will I Receive My Monthly Statement?

We anticipate you will typically receive your monthly statement around the 25th of the new month depending on how long it takes our sub-advisors to complete their monthly close process. We will also provide an estimate on the 1st of each month via our email distribution list which investors are automatically added to.

If you are not receiving the monthly estimate or the updated statement, please email invest@mutinyfund.com.

What Will My Monthly Statements Looks Like?

Each month, investors will receive a statement from our Third Party Administrator similar to the one below. Statements should come out around the 25th of the month. They will typically look similar to the below:

We have annotated the document with the blue text to explain each line item.

To help clarify what each of the line items represents:

  • Beginning Balance: the balance of your capital account prior to the beginning of the month.
  • Additions: any additions you made to your account that went into effect that month.
  • Redemptions: any redemptions from your account that went into effect that month.
  • Management Fees: This is the 1% management fee/annum that Mutiny charges to manage the assets. The amount taken out is annualized (i.e. 1/12 of 1% is paid monthly).
  • Performance Fees/Allocation (AKA Mutiny Funds/APA Incentive Fee): This is the incentive fee that Mutiny Funds charges based on our performance. This crystallizes quarterly.
  • Trading Advisor Management Fee (AKA Sub-Advisors Mgmt Fee): This is the management fee which our sub-advisors (the hedge funds we allocate to) charge. Likewise it is annualized (i.e. 1/12 of the annual amount is paid monthly). The amount varies from sub-advisor to sub-advisor.
  • Trading Advisor Incentive Fee (Sub-Advisor Incentive Fee): This is the percentage of gains that each sub-advisor takes on trading profits. This also varies manager to manager.
  • Operating Expenses: This is operating expenses incurred by the fund in the normal course of business. This reflects things like the annual audit, state filing fees and bank fees.
  • Net Income: The net gain or loss for your account in that month.

Please note that all our funds use a high watermark or benchmark. In the case of a high watermark, investors are only assessed an incentive fee on net new profits. As an example, if you were to invest $100k and the value of your investment goes down to $95k then up to $105k, you would only pay the incentive fee on the $5,000 gain from $100k to $105k.

This means that depending on when someone invests, they will receive different returns than someone who invested at a different time. We try to account for the high watermark in the public number in the Tortuga Times or first of month estimates email but given everyone began investing at a different time, there will likely be discrepancies between the public numbers and your statements. Your statement number is the one you should rely on for tracking your personal investment’s value.

Is There a Portal I Can Log In to View My Investment?

We can provide access to an online portal. Please note that the fund only strikes a Net Asset Value (NAV) once per month (around the 15th) so this number will not change other than the one day per month when we will also send out your statement via email. That means the portal will not give you any additional information to what you will receive via email, merely let you access it in your browser as opposed to in an email.

If you would like access to the portal as a reference then we are happy to facilitate that. Simply complete the form at the bottom of this page and select the “I want access to the portal with my monthly statements” option from the drop-down menu.

Who are Mutiny's Service Providers?
  • Fund Structure – The fund is a Delaware LLC operating as registered commodity pools and regulated by the National Futures Association. It is co-managed by Mutiny Funds [NFA ID: 0523924] and Attain Portfolio Advisors [NFA ID: 0339046].
  • Fund accountant/controller – NAV Consulting (Best Fund Administrator – 2023 Hedgeweek US Digital Assets Awards)
  • Auditor – Cohen & Co (Hedgeweek’s Best Audit Provider – U.S. Digital Assets Awards)
  • Tax preparer – Cohen & Co
  • Legal counsel – Howard & Howard, Jeffrey Barclay
  • Bank – CIBC
  • Compliance Consultant – RCM Alternatives

The Cockroach DDQ

Updated: October 12, 2023

Disclaimer:
The following is designed to be informative in nature, but is not exhaustive and should not be considered apart from the full disclosures contained in the Fund’s offering memorandum. Any offer or solicitation of the Fund(s) may be made only by delivery of the Memorandum(s). There are no guarantees the strategy will perform as expected or designed, and any information described herein may change or evolve without notice. All discussions of costs relate solely to the U.S. Funds – Cockroach Fund, LLC and Long Volatility Fund, LLC. Investors into Mutiny Cayman Funds, Ltd. may be subject to other costs.

How Did You Construct the Cockroach Strategy?

Many approaches to diversification, such as the 60/40 stock/bond approach, rely on historical statistical correlations. We believe that historical correlations can be informative, they should not be solely relied upon as they are often subject to change as the economy moves through different regimes.

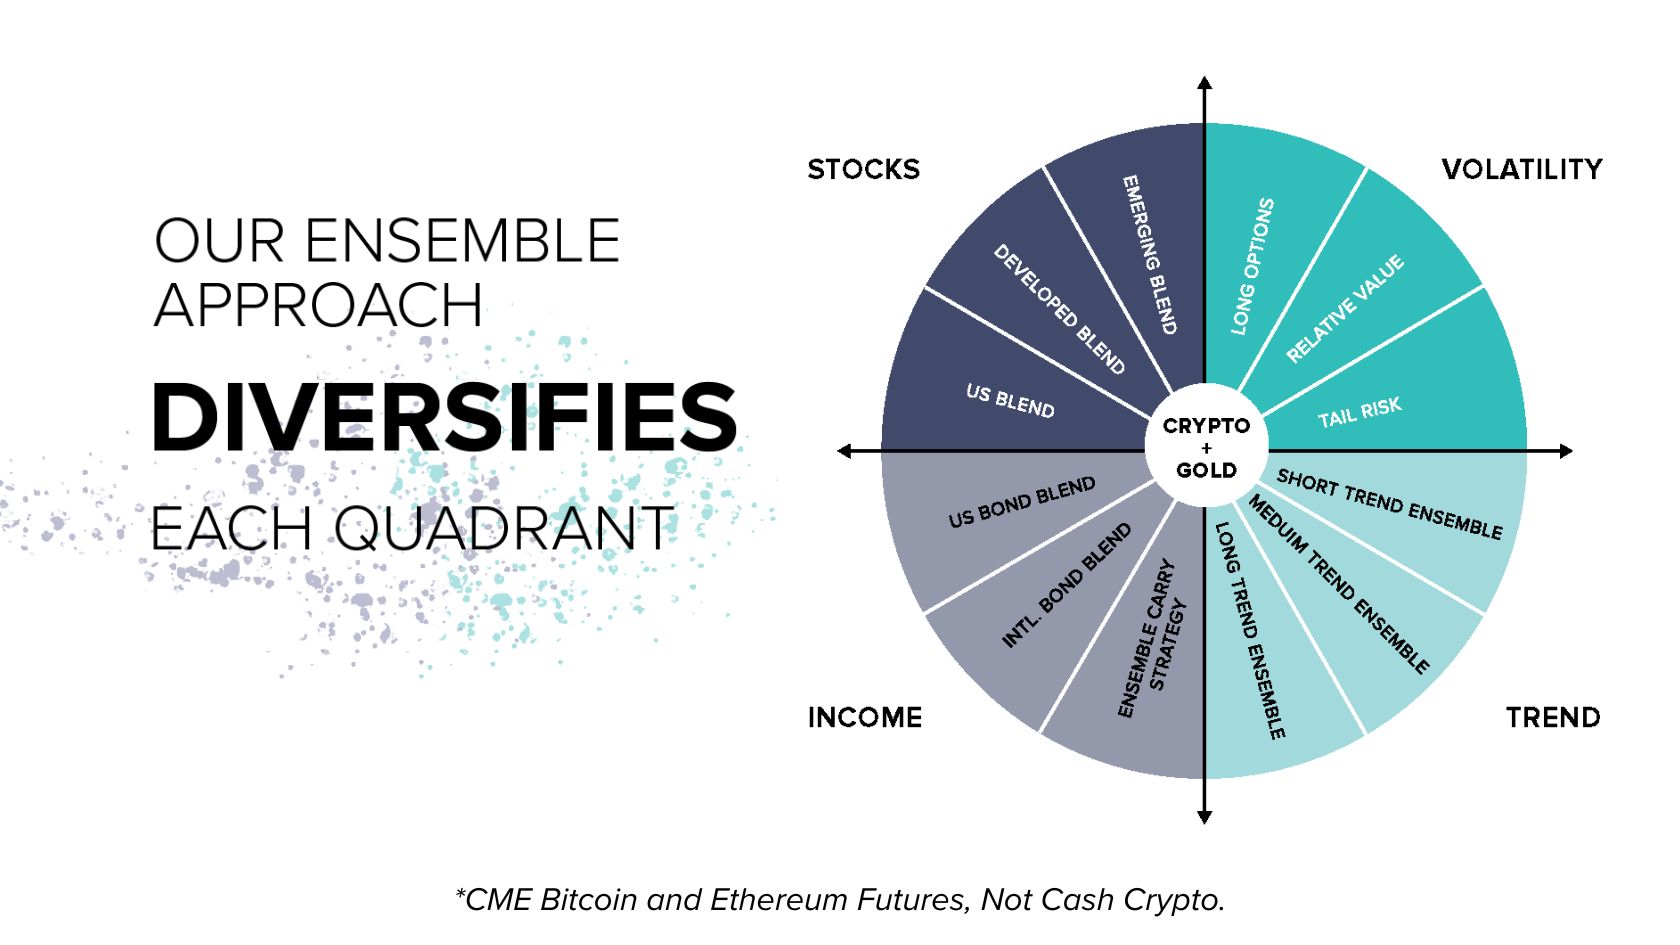
Instead of starting with historical correlations, we start with the four quadrant model of different macroeconomic regimes: growth, decline, inflation and deflation. All periods of financial history can be categorized as one, or a combination, of these four regimes.

For each of those quadrants, we sought to identify asset classes and investment strategies with return drivers that we feel will benefit from each of these macroeconomic regimes.

A return driver is the primary underlying condition that drives the price of a market. As opposed to using shorter term historical correlations, return drivers seek to identify fundamental relationships between an asset or strategy and the different macroeconomic environments.

The four return drivers we believe will do well in these different environments are:

  • Stocks tend to do well in Growth
  • Income Strategies tend to do well in Deflation
  • Volatility strategies tend to do well in Decline
  • Trend Strategies tend to do well in Inflation

We view each of these strategies as having one core environment where it should do the best, but also able to “overlap” and augment the other strategies. For instance, income strategies can do well in growth environments as can trend strategies. Volatility can do well in an inflationary environment and Trend can do well in Decline.

This seeks to provide more robustness and resilience to the overall portfolio and maximize the chance number of periods in which the overall return is positive which should increase the long-term returns.

We call this approach fractal diversification. Diversification across the four macro quadrants is a good starting point, but even better is diversification within each of those quadrants.

By including not just US markets, but global stocks and global bonds, different income strategies, three different volatility strategies and three different trend approaches, the Cockroach Strategy diversifies within each of the quadrants, seeking to further reduce the risk and increase the returns of the portfolio.

Ultimately, we believe this approach will help investors improve their risk-adjusted returns, both more efficiently compound their while better mitigating drawdowns in the interim.

What Exactly is In Each of The Sub Strategy Buckets?

Stocks

We see stocks as fundamentally correlated to economic growth. When GDP is increasing, corporate profits tend to increase as well which is the long-term driver of equity prices (though there can be plenty of fluctuations in the short to medium term).

Within the equities strategy, the Cockroach Strategy intends to have 60% allocated to a broad basket of US stock index futures (S&P 500, Nasdaq, and Russell 2000) and 40% to International stock index futures (developed and emerging markets) to achieve broad diversification across equity markets.

Specifically, the stock sub-strategy includes:

  • U.S. Stock Market Exposures include S&P 500, Nasdaq, and Russell 2000
  • Developed Market Exposures include: MSCI EAFE (Australia, Austria, Belgium, Denmark, Finland, France, Germany, Hong Kong, Ireland, Israel, Italy, Japan, the Netherlands, New Zealand, Norway, Portugal, Singapore, Spain, Sweden, Switzerland and the UK)
  • Emerging Markets Exposures include: MSCI Emerging Markets (Argentina, Brazil, Chile, China, Colombia, Czech Republic, Egypt, Greece, Hungary, India, Indonesia, Korea, Malaysia, Mexico, Pakistan, Peru, Philippines, Poland, Qatar, Russia, Saudi Arabia, South Africa, Taiwan, Thailand, Turkey, and the United Arab Emirates)


Income

The Income sub-strategy is designed to replicate the consistent source of income historically provided by bond investments and consequently perform well in a deflationary environment.

Where stocks can struggle in deflationary periods (or periods of declining inflation known as disinflation) because of the increased debt service, the bond holders which are providing that debt can benefit.

While bonds are the most common and easily accessible return driver for a deflationary environment, we believe that other assets which provide a yield such as carry trades also serve the same core function of providing income to the portfolio while offering diversification benefits beyond just bonds.

The Cockroach Strategy has a diversified income strategy that includes exposure to:

  • US Treasury Bond Futures – A blend of US Treasury Note and Bond Futures ranging from 2 years to 30 years. The bonds are position sized in such a way that each has a target duration of 15 years, allowing for diversification across the yield curve.
  • Global Bond Futures – A blend of German, UK, Canadian, Japanese and Australian Bonds sized in such a way that each has a target duration of 15 years.
  • An Ensemble of Carry Strategies – The ReSolve Ensemble Carry strategy we are using seeks to harness carry returns from over 70 global futures markets across equity indices, bonds, currencies and commodities. The strategy seeks to maximize long exposure to assets with positive carry and maximize short exposure to markets with negative carry, while minimizing the overall risk of the portfolio. Learn more about Carry Strategies here.


Trend

The Commodity Trend sub-strategy seeks to do well in prolonged declines in equity markets, as well as Inflationary environments due to their substantial exposure to commodity markets. We believe that commodities are the most fundamental return driver linked to inflation, since inflation is (typically) measured against a basket of commodities or products made using commodities.

That’s not to say an inflationary environment will just affect commodity prices. Currencies, interest rates, and stock markets would likely move as well. The Trend sub-strategy includes exposure to all of them (going both long and short) as part of our Trend bucket.

We believe the Trend bucket should help augment our volatility bucket in the case of a prolonged recession while leading the charge in a sustained period of high inflation.

We believe that this makes it superior to buy and hold commodities approaches as it is able to benefit from both rising and falling commodity markets as well as trends in other markets.

We include managers with short-term, medium-term, and longer-term look back periods (ranging from a few days to many months) trading across 100+ futures markets. We believe this maximizes our chance of capturing the bulk of a sustained trend move.

For more detailed information on the managers and strategies we employ, please see our Commodity Trend Strategy DDQ.


Long Volatility

Volatility is known to expand, sometimes dramatically, in both sharp and extended stock market declines. Volatility then is the return driver which appears most fundamentally linked to such declines.

We do not believe that the most common equity hedge, U.S. government bonds, will necessarily do well if stock prices decline sharply. Rather, our research indicates that this is a historical correlation which has come and gone over history. We see no such structural reason that traditional safe haven assets like government bonds will fare well whereas a put option on the S&P, for example, will pay out if the S&P declines past its strike price.

There is a cost to buying such put options, of course, which is why they are a piece of a larger strategy.

To achieve its long volatility exposure, The Cockroach Strategy will invest into the same sub-managers as those used in Mutiny Funds’ Volatility Strategy.

It is intended as an efficient vehicle for investors seeking diversification, long volatility exposure, and tail risk protection, and combines four types of long volatility strategies across a basket of managers.

This ensemble approach is designed to have minimal carry costs in good years for the market, while maximizing the certainty of providing large, convex returns in volatile market crashes (e.g. 2001-2003, 2008-2011, Q1 2020).

For more detailed information on the managers and strategies used, please see our Volatility Strategy.


Gold and Crypto Assets

Since the four core strategies (stocks, volatility, trend, and income) are predominantly denominated in U.S. dollars, we include gold as a hedge against fiat risk from a prolonged period of high inflation.

Additionally, gold provides another uncorrelated return stream which, when rebalanced with the rest of the portfolio, should improve the risk-adjusted returns during “normal” periods with low to moderate levels of inflation.

Many of the same fiat protection logic exists for owning crypto currencies such as Bitcoin and Ethereum. In addition, crypto assets such as Bitcoin are historically uncorrelated to traditional asset classes and offer the potential for asymmetric risk/return profiles. The Strategy will seek limited Bitcoin exposure via CME Group Bitcoin and Ethereum futures contracts. In the future, if the regulatory landscape for these assets becomes more clear, we may add other crypto assets, and likely apply our ensemble approach to combine niche active managers implementing different trading strategies across the crypto landscape.

A portion of our gold exposure is held in physical gold, resulting in about 5% of the Cockroach Strategy currently sitting in physical gold bars. The remainder of the exposure is via Futures contracts.

I Like The Cockroach Portfolio Except I Don’t Like That You Included X, Can I Customize It?

Due to our structure, we are not able to customize the exposures inside of the Cockroach Strategy based on individual investors preferences.

Our Defense Strategy, Volatility Strategy, and Commodity Trend Strategy are available as standalones to give investors the ability to construct their portfolio as they see fit.

The Volatility Strategy is designed to act as a so-called ‘black swan’ investment, achieving asymmetric gains in times of high volatility or tail risk (e.g. March 2020). The Commodity Trend Strategy is designed to profit during inflationary periods (e.g. 2022) as well as during extended ‘crisis periods’ for stocks and bonds (e.g. 2008).

The Defense Strategy combines Mutiny Fund’s Volatility Strategy and Commodity Trend Strategy. It is intended for investors who wish to add a Defensive component to their own offensive assets such as stocks, bonds, and private equity.

Having said that, our view is that having a truly diversified portfolio means that you will almost always hate at least one thing in the portfolio. It’s not uncommon that the most hated asset will go on to perform the best: in the wake of the 1970s, many investors in the early 1980s didn’t want to include bonds in their portfolios. The media sometimes referred to bonds as “certificates of confiscation” in 1980. Then, the 1980s and 1990s ended up being a huge bull market in bonds.

We take no view on where interest rates or bond prices (or any other asset prices for that matter) will go, but rather focus on diversifying our income sub-strategy (as we do all other strategies) such that we do not feel overly exposed to any single asset or strategy.

In a sense, the Cockroach Strategy is designed to be the “least bad” portfolio rather than the “best” over any short term period. It is designed to have some asset which performs well in any macroeconomic environment, seeking to minimize drawdowns and maximize risk-adjusted returns without needing to predict macroeconomic regime changes. It is our belief that the key to being the best in the long run is more about trying to make sure you are never the worst over any short period.

How Often is The Portfolio Rebalanced?

The Cockroach Strategy will rebalance between its sub-strategies on a monthly basis.

Are there Capacity Constraints for The Cockroach Strategy?

We believe the main limiter to the scale and strategy capacity will be the capacity of the volatility strategy. We believe capacity constraints wouldn’t be experienced until around $1-2 Billion in assets under management in the Cockroach Strategy.

How Much Should I Allocate to The Cockroach Total Portfolio Strategy?

Of course, the question of how much you should invest is unique to your situation and nothing we say here is a substitute for speaking with a financial advisor or the use of your own judgment. Having said that, we can offer a few ways of how we personally think about it.

We personally view the Cockroach Strategy as a core liquid portfolio that can be effectively paired with illiquid alternatives such as Real Estate, Venture, or Private Equity.

For instance, an investor with a 50%/50% split between liquid/illiquid assets could allocate 50% of their assets to the Cockroach Strategy or similar total portfolio approaches and then use the remaining portion to diversify into illiquid alternatives and rebalance as those investments became liquid.

Investors that wanted to retain some of their liquid assets at another custodian could also do that and utilize whatever liquid strategy they deemed appropriate there.

One barbell-like approach would be to allocate 50% to the Cockroach Strategy of the Cockroach Fund, 25% to a diversified portfolio of liquid assets at a custodian (e.g. Schwab, Fidelity, TD Ameritrade) and 25% into illiquid alternatives such as Real Estate, Venture Capital, or Private Equity.

Of course, this is our personal view and investors should carefully consider the risks and use their own good judgment to make whatever allocation they deem appropriate.

How Does The Cockroach Strategy Compare to Philosophically Similar Approaches With Other Vehicles Like ETFs?

There are a number of other products with philosophically similar approaches to our Cockroach Strategy using a variety of structures. In particular, some investors prefer ETF structures for their simplicity and ability to hold them in existing brokerage accounts.

We have done a substantial amount of research on ETFs and other structures. Our research has indicated to us that the limitations which are inherent in an ETF substantially reduce the risk-adjusted performance of the strategy.

In particular, ETFs restrict the use of active managers. It is not possible, to our knowledge, to include active managers in an ETF structure. About half the Cockroach portfolio relies on actively managed long volatility and trend strategies.

As a result, substitutions or alternate approaches need to be taken for half of the portfolio. Our research and belief suggests that this significantly impairs the effectiveness and performance of the strategy. We believe that a structure which allows the use of active managers is ultimately better for investors. Additionally, because we primarily utilize commodity futures, we are able to be more capital efficient.

Though we are all about making it as easy as possible for investors and will continue to look at different vehicles, ultimately our goal is to build the most effective product and we believe our current structure best facilitates that.

We have also done a lot of work to streamline our onboarding and redemption process and generally find that it takes most investors about 20-30 minutes to go through the onboarding and 5 minutes to redeem.

What Is The Total Exposure Of The Cockroach Strategy?

The portfolio will have a target nominal exposure of 220%. This means that for a $100k investment that the investor will get $220k of nominal exposure to the different return drivers.

Approximate weightings exposure across the strategies in this example would be:

  • $50k Stocks
  • $50k Income
  • $50k Volatility
  • $50k Trend
  • $15k Gold
  • $5k Crypto Assets

How is the exposure greater than 100%?

We overlay the exposures on top of each other via the built in leverage of commodity futures,*1
which results in our exposure being roughly ~2.2x the assets of the strategy. We offer this level of exposure for two reasons.

For one, we believe that the use of modest leverage such as this across a well-diversified portfolio such as the Cockroach Total Portfolio Strategy is a better way to achieve return targets – as contrasted with taking more risks in an unlevered portfolio.

The whole idea of a well diversified portfolio is to achieve better risk adjusted returns which means either

  1. Provide the same return with lower risk, or
  2. Provide higher returns with the same risk.

If your diversification results in both lower return and lower risk, we believe the prudent approach is to add a modest amount of leverage to increase the return while remaining well within acceptable risk limits.*2

We believe this level of exposure will mostly “keep up” with more traditional portfolios (such as the 60% stock/40% bond portfolio) in good markets and significantly outperform these traditional portfolios in bear markets.

Consider a period where stocks and bonds are performing well but where the volatility and trend buckets are flat. In this scenario, the portfolio would perform roughly as well as a stock/bond only portfolio, while still carrying protection against a recession or inflationary period.

Further, there are cost savings to this approach for the investor. As the Fund’s fees are based on the cash invested, not the nominal exposure amount. That means that for the $225,000 of exposure gained through a $100,000 investment, the 1% annual management fee is just $1,000 instead of $2,250. This allows for investors to pay less fees in order to get the same level of exposure.

In sum, our research indicates that for a portfolio that is as highly diversified as the Cockroach strategy, this use of leverage keeps our risk within acceptable limits while allowing a more capital efficient and fee efficient solution for our investors.


*1 Because the bulk of the assets in the strategy are done using the futures markets, we just have to post margin to control the positions. What this looks like in practice is generally needing to post around 5% to 20% of the nominal size of the exposure as a “performance bond” in the account to put on and maintain those positions.

So, for example, you could get $1 million worth of futures exposure with just $200,000 in the account. Because of this natural leverage built into futures markets and the cash efficiency it affords – there is sufficient capital to put on exposures greater than the cash amount invested.

If you are unfamiliar with how futures contracts work, we recommend this presentation from Dr. Kathryn Kaminski beginning at 4:10 as a short introduction.

*2 See AQR’s explanation of leverage used in their risk parity strategy here for a more robust explanation of this logic.

How Were The Hypothetical Back Tests Performed?

Hypothetical performance for the Cockroach strategy going back to 1990 is available in our presentation for QEP investors.*3 The data sources and methodologies used are listed in the disclaimer at the end of the presentation. Generally speaking the results use actual sub-advisor returns from 2006-onwards, and index performance (such as Barclay Aggregate Bond Index) prior to that for each asset class.

We did NOT include bitcoin or other crypto assets in the results as we did not feel that its historical performance was realistic on a walk-forward basis. Instead gold is substituted for the bitcoin allocation in the backtest.

We chose to extend the back test to 1990 because we felt it was a long enough time period to show the robustness of the portfolio but generally a period where acceptable data sources are available.

For instance, options did not exist until the 1970s and so the estimated returns of an option strategy prior to that time involves hypothetically calculating what option prices would have been, had they been tradable. Similar challenges exist for our carry strategy, as well as parts of the trend strategy. We view that any backtest using hypothetical data (including our own) should be viewed as a useful toy model or “intuition pump” for thinking about portfolio construction rather than a reliable estimate of performance going forward.

The broad conclusion that we draw from our research and others is that investors are likely to improve their risk-adjusted returns from diversifying their portfolios from a more typical stock/bond focused portfolio to include substantial allocations to commodity and volatility strategies. We do not feel we nor anyone else has the ability to draw much more specific conclusions than that, nor do we believe that we are able to forecast returns or risk metrics.


3* These presentations are intended only for investors that qualify as “QEP.” If you aren’t sure if you qualify as QEP, you can see what that means here. Please note that the investment itself is available to all accredited investors. The QEP requirement is only required to view the hypothetical composite performance of our sub-advisors prior to Mutiny’s launch. Any accredited investor may invest.


What Is The Type Of Environment Where You Expect The Cockroach Total Portfolio Strategy To Struggle?

The Cockroach Strategy is designed to be the best liquid portfolio we can construct. It seeks to perform well in any macroeconomic environment. However, many investors benchmark performance to equities and we expect there will be periods where the Cockroach Strategy substantially lags equity performance and will outright lose money.

In the interest of helping set clear expectations, we’ve identified a few environments where we would expect Cockroach to struggle on both an absolute and relative basis.

Irrational Exuberance

A period of exuberance in equity markets with volatility, trend, gold and commodities all experiencing overlapping drawdown/flat periods is likely to result in underperformance of the Cockroach strategy relative to equities.

For example, the period from January 1999 to October 2000 where equities rose rapidly into the height of the dotcom boom would likely result in significant equity outperformance while we would expect the Cockroach strategy to be roughly flat or even slightly down.

In our view, these periods tend to set the stage and something will eventually have to give. To use the dotcom boom as an example, we would still expect the Cockroach portfolio to do well on a longer term horizon (say 5 years from January 1999 through 2004), while equities would have declined following the bust.

Though we believe that the Cockroach strategy will outperform over the long run, we fully expect that there will be multi-quarter if not multi-year periods of underperformance relative to certain common benchmarks such as the S&P or a 60/40 portfolio such as this one.

Mild Sell Offs

Another environment where we would expect the Cockroach strategy to struggle is a mild to moderate sell off across offensive assets. In general, the volatility component of the strategy is not intended to perform well in a move of less than -10% down in equity markets and not really accelerate until a -20% down move.

This means that it is very possible that you could see a -10% move in equities accompanied by similar drawdowns in bonds with the commodity and volatility strategies flat or even negative resulting in a meaningful drawdown for the Cockroach strategy.

One such historical example would be February 1994 to March 1995. In that instance, a surprise interest rate hike from the Federal Reserve sent stocks, bonds, gold, and volatility heading down. We anticipate that the trend portion could help in that type of environment but likely wouldn’t do enough to buoy the rest of the portfolio.

The Cockroach strategy is intended as a longer term investment and we expect that it would ultimately recover and do well over the subsequent five years. In our view, the assets we are using are fundamentally uncorrelated so eventually something will have to give and one will perform well.

Ultimately, we feel that the only lesson we can take from these scenarios is that even uncorrelated strategies such as the ones we use will sometimes go through periods where they become correlated and the portfolio suffers. This is to be expected and we fully expect such periods of underperformance and losses to occur in the future.

Though it is impossible to forecast, our expectation would be that these periods should be fairly short-lived compared to less diversified portfolios such as the more common 60/40 stock/bond portfolio.

What Are The Fees Charged By Mutiny?

For the Cockroach Strategy, the fee structure is a 1% management fee and 10% incentive fee.

We use a “high watermark” meaning investors are only assessed an incentive fee on net new profits. As an example, if you were to invest $100k and the value of your investment goes down to $95k then up to $105k, you would only pay the incentive fee on the $5,000 gain from $100k to $105k.

Volatility Strategy​ DDQ

Updated: July 1, 2023

Disclaimer:
The following is designed to be informative in nature, but is not exhaustive and should not be considered apart from the full disclosures contained in the Fund’s offering memorandum. Any offer or solicitation of the Fund(s) may be made only by delivery of the Memorandum(s). There are no guarantees the strategy will perform as expected or designed, and any information described herein may change or evolve without notice. All discussions of costs relate solely to the U.S. Funds – Cockroach Fund, LLC and Long Volatility Fund, LLC. Investors into Mutiny Cayman Funds, Ltd. may be subject to other costs.

How Is The Volatility Strategy Designed? What Should I Expect?

The goal for the Volatility Strategy is to attempt to have flat or only slightly negative returns in non-volatile years for the market while achieving substantial 25-50% returns in very volatile years.​ The Volatility Strategy uses an ensemble of long volatility focused hedge funds which seek to create this payoff profile.

Said another way, we designed the Volatility Strategy to be convex in the event of a crisis. That means if the markets go down -10%, the volatility strategy may not post significant gains and could even have losses. However, if the markets go down 30%, we would hope for the Volatility Strategy to be up 30%+ as the convexity kicks in. Of course, it is impossible to know this a priori, but, we have constructed the portfolio with this in mind.

The convexity of the strategy is achieved through the structure of the instruments that they employ such as VIX futures and options. For example, the last week of February 2020– the stock market fell -7%, and the VIX (for sake of easy math) spiked +70%. However, the VIX didn’t spike 10% for every 1% down move in stocks. It maybe did 5%, then 15%, then 35%, and so forth. The VIX increases non-linearly, that is, at an increasing rate. That structure creates convexity in our return profile.

Similarly, the sub-managers who buy options have a set price they pay for an option, but the amount they can gain on the option is unbounded. They can earn 1 to 1, 5 to 1, or 100 to 1, depending on the speed and extent of a given market move. Because they are buying options, there is an asymmetry: gains are uncapped while losses are capped. They can’t be wrong and lose 1 to 100, they can only lose the premium they pay for the option.

In short, the convexity of the portfolio is driven by sub-managers targeting an unbounded, asymmetric payoff structure for the amount of risk they are taking.

How Much Should I Invest In The Volatility Strategy?

The question of how much you should invest is, of course, unique to your situation and nothing we say here is a substitute for speaking with a financial advisor or the use of your own judgment. Having said that, we can offer a few ways of how we personally think about it.

We believe that the best combination of offensive assets and defensive assets is approximately equal weight as embodied in our Cockroach Strategy.

In that framework, long volatility accounts for approximately 25% of the total exposure across the portfolio. Investors wishing to follow that guideline would then need to allocate ~25% to the Volatility Strategy.

For investors that wish to use the Volatility Strategy in some other way or to customize the weightings, we can offer this guidance.

We designed the Volatility Strategy to be convex in the event of a crisis. That means if the markets go down -10%, the volatility strategy may not post significant gains and could even have losses. However, if the markets go down 30%, we would hope for the Volatility Strategy to be up 30%+ as the convexity kicks in. Of course, it is impossible to know this a priori, but, we have constructed the portfolio with this in mind.

As a simple example, if you have a portfolio that is 90% stocks and 10% Volatility Strategy, then a 30% decline in stocks with an offsetting 30% increase in Volatility Strategy would lead to the overall portfolio being down 24% rather than 30% (compared to if it was 100% allocated to stocks). To more fully offset risks in short volatility instruments like stocks would likely require a larger allocation.

Of course, your investment amount is a personal choice and you should consult with your financial advisor and exercise your own good judgment.

How Does The Volatility Strategy Compare To Other Similar Options?

Based on our research, we believe that:

  1. The overall risk/reward of a portfolio is much stronger with a long volatility component.
  2. An ensemble of actively managed volatility strategies such as Mutiny Funds’ Volatility Strategy is the best way to achieve this exposure. Our research indicated that, after fees, active management from the best long volatility sub-managers substantially outperforms more passive option strategies.

To take these points in turn:

We believe a portfolio is better with a long volatility allocation.

Most investors begin with the question, what is the best possible asset to own? We start with a question that seems only slightly different but leads to a much different conclusion than what most investors own: What is the best possible portfolio to own?​

As a simple example, let’s say you have the ability to buy two assets out of a possible three choices. ​

The first two assets (Zig and Zog) have positive returns but are highly correlated; they track one another and the business cycle. Both do well when markets are up and poorly when markets are down.​

The third asset (Zag) loses money overall. It has a slightly negative return. However, while Zag loses money overall, it makes profits in periods where markets, along with Zig and Zog, are falling. That is, its most substantial gains are reserved for the periods when the other assets are in crisis.

If you can only buy one asset, Zig or Zog seem like the two best choices.

But, if you can buy two, what is the best overall portfolio?​

Counterintuitively, the portfolio that combines the worst performing, but negatively correlated asset (Zag) with Zig outperforms from a risk-adjusted perspective.

In this example, by combining Zig and Zag, which are negatively correlated to each other, when Zig goes down, Zag tends to go up, and vice versa.​

​If you are rebalancing between the two assets, you are effectively buying low and selling high. When Zig is doing well and Zag is losing money, you are selling some of Zig to buy some of Zag.​

Vice versa, when there is a market crash and Zig loses value, Zag increases and so you are selling Zag to buy more of Zig at reduced prices. That means when the market rallies, you will own more of Zig and participate in more upside.​

​By combining Zig & Zag, you generate better risk-adjusted, long-term returns than Zig & Zog. Though it’s counterintuitive, that is how the math works out and why we believe that diversification is so important.​

If you want to increase your returns, we believe you are much better off adding a modest amount of leverage to the properly diversified portfolio (Zig and Zag) rather than using a portfolio that has correlated risks (Zig and Zog).​

​Assuming correlations hold, Portfolio Zig & Zag is less susceptible to blow-up risk or large declines, so you know that money will be there when you need it. If an investor has to eventually reduce their exposure because of losses, or because of retirement, or a lost job, or because a loved one got sick and needed an expensive treatment, they will probably be happier to have the Zig & Zag portfolio.​

In this example, Assets Zig and Zog are intended to reflect the performance of short volatility assets (stocks, bonds, real estate, VC, PE, etc.) and Zag is a long volatility asset such as the Volatility Strategy. The combination of the two outperforms either individually.

Mutiny Funds’ Volatility Strategy seeks to perform the role of Zag, performing well when the rest of your portfolio struggles. The Volatility+Stocks Strategy seeks to function similarly to the Portfolio of Zig & Zag.

Our Cockroach Strategy seeks to provide a fully diversified portfolio via a single vehicle and so may be most appropriate for investors seeking a single solution rather than wanting to use the Volatility strategy as part of a broader DIY approach.

  • We believe that using the Volatility Strategy is the best way to do that after fees because what you pay for in Active management should be less than the bleed of using a more passive approach.

There are lower fee options that are designed to offer long volatility strategies which perform like Zag.

However, in our experience, passive long volatility strategies are inferior over the long run when compared to more actively managed strategies. While net of fees, passive stock and bond strategies can be very effective, we have not found this to be the case in the long volatility space where we believe active management is worth the additional costs. Please see our post on What is the VIX and how is it traded? for more information on the challenges of passive long volatility strategies.

The skill that we’re paying our sub-managers for is being able to do better than a passive approach over the course of a full market cycle (typically 5-10 years). We believe they can offer more upside in bad years for the market, with lower bleed in good times.

You could think about buying volatility as playing Roulette. There are 36 numbers on a Roulette wheel and so, rationally, anytime someone offers you better than 1 in 36 odds, you should take that bet because it is a positive expected value.

If you could place a bet that paid off 100 to 1 for number 23, that’s a good bet even though you are unlikely to win. You can think about the vol market like a Roulette wheel where the croupier, the market, has a short memory. If 17 came up three times in the last 10 spins, then you may only get 5 to 1 odds for 17 because the market is worried about another 17.

However, you may get 100 to 1 on 23 because there hasn’t been a 23 in quite some time. What our sub-managers are doing is going around and looking for the 23s, the relatively cheap vol which helps us to maintain the convexity while managing our carry costs in good years. This introduces the risk that there will be periods where 23 will not come up as much as expected and so they will underperform more passive approaches, but over the long run, we believe they will be able to take advantage of market inefficiencies and achieve superior risk-adjusted returns.

Because these strategies are capacity constrained and it requires a great deal of skill, we believe those sub-managers can demand and justify their fees.

How Long Have You Been Live?

The Volatility Strategy has been live since April 17, 2020.

How Did You Construct The Volatility Strategy?

We choose sub-managers by first identifying the broader universe of long vol managers and doing due diligence, reviewing data, decks, phone calls, and in person meetings. We then classify them into one of our three sub-strategies:

  1. Long Options
  2. Relative Value
  3. Tail Risk

We build the portfolio around our long options sub-managers as the core. We like long options because we view them as a form of “debit card investing”, which acts as a sort of non-recourse leverage. That is, long options positions have the potential to return 10 to 1 or even 100 to 1, but you can only lose the principle that you pay in.

We have the largest percentage of the strategy allocated to long option strategies as they provide the most convexity and tail risk protection, they also typically have the most bleed associated with them and rely on spikes in volatility to perform.

Around the Long Options sub-strategy, we added our Relative Value sub-strategy.

The Relative Value strategy can profit in up markets, attempting to provide an income stream that helps us to achieve a positive carry over a risk on cycle. Our implementation of relative value managers is different from other relative value strategies because we seek out managers that have a ‘long volatility bias’ to their trading strategies. That means, they can flip and go long volatility so it can also do well in a crisis event along with the rest of the portfolio. We believe that combining it with our existing strategies further improves the overall return profile.​

Finally, we include our tail risk sub-strategy. Like the Long Options sub-strategy, they offer a good deal of convexity in the case of a sharp sell-off. However, they are different in that they offer a type of ‘always on’ protection.

Our Long Options sub-managers engage in some form of market timing which seeks to limit their losses and increase their gains. This timing usually involves a reliance on market data and so may not necessarily exogenous events. For instance, an exogenous event like a war breaking out on a Sunday would not be reflected in any market data from the prior trading day on Friday. The Tail Risk sub-strategy accepts the slightly higher bleed that can be associated with ‘always on’ protection in exchange for being able to protect against exogenous ‘tail risk’ events such as war or, dare I say, an unexpected pandemic.

Within each of these sub-strategy, we aim to have multiple sub-managers to diversify the idiosyncratic risk of any single sub-manager. We also have different flavors of market microstructures which we believe should improve the risk-adjusted return of the Volatility Strategy. For example, one sub-manager in our relative value sub-strategy could trade exclusively U.S. markets while another trades European and Asian markets.

All of this allows us to cover more potential path dependencies with the goal of maximizing our probability of capturing any sort of risk off event with a convex return profile while not bleeding too much in good years for the market.

We feel that this structure is the best combination of the three components we want out of a long volatility strategy:

  1. Convexity – the rate of increase in a hedge’s payoff as equities decline
  2. Certainty – the level of confidence that the hedge will capture an equity sell off
  3. Carry – the cost of employing the strategy in low volatility markets when equities are rising

Generally, we think of each sub-strategy in this way:

  1. Long Options = High Convexity, Medium Certainty, Slightly Negative Carry
  2. Relative Value = Medium Convexity, Low Certainty, Positive Carry
  3. Tail Risk = High Convexity and High Certainty, Negative Carry

We believe that our ensemble approach of multiple sub-strategies will allow us to achieve a strategy which will be roughly flat over the course of a bull market cycle (3-7 years) while exhibiting a high certainty of convex returns in the case of a major sell-off.

Can You Provide Additional Information On The Active Sub-managers?

We have hosted many of our managers on the Mutiny Investing Podcast. You can download the podcasts on your favorite podcast app or listen/read the transcripts on our website.

Note: Manager composition is subject to change without notice.

How Does The Long Options Sub-strategy Work?

We built the core of the portfolio around buying options. An option is a financial instrument that allows investors the right, but not the obligation (hence the option) to buy or sell an underlying asset at a specified time at a specified price.

  • Call options allow the holder to buy the asset at a specified time at a specified price. A call option generally benefits when the price of the underlying asset increases over time so it is typically a bet on the market going up.
  • Put options allow the holder to sell the asset at a specified time at a specified price. A put option generally benefits if the price of the underlying asset will decrease so it is typically a bet on the market going down.

For example, if there is a stock currently trading at $100, you could buy a put option for the right to sell the asset at a specified time (say the end of next month) at a specified strike price (say $90).

Let’s say this option costs $1. So, you pay $1 up front for the right to sell the stock for $90 at the end of the coming month. If the price of the stock falls to $85 in that time period, you can buy the stock for $85 in the open market and use your option contract to sell it for $90, pocketing a $4 profit: $90-$85-$1 that the option cost you.

If the stock ends the month at any price higher than $90, then the option expires worthless and you lose the $1 you paid for the option.

We like buying options because they have a fixed downside (the $1 this example) but an uncapped upside. It is a form of “debit card investing” – you can’t lose any more than you spend.

The benefit of options is that they function as a form of non recourse leverage. You get convex exposure in the way you would if you used leverage, but unlike using leverage, your downside is capped – you don’t have to risk any more than the premium you put in.​

You could think about buying options as playing Roulette. There are 36 numbers on a Roulette wheel and so, rationally, anytime someone offers you better than 1 in 36 odds, you should take that bet because it is a positive expected value.

If you could place a bet that paid off 100 to 1 for number 23, that’s a good bet even though you are unlikely to win. You can think about the vol market like a Roulette wheel where the croupier, the market, has a short memory. If 17 came up three times in the last 10 spins, then you may only get 5 to 1 odds for 17 because the market is worried about another 17.

However, you may get 100 to 1 on 23 because there hasn’t been a 23 in quite some time. What our sub-managers are doing is going around and looking for the 23s, the relatively cheap vol which helps us to maintain the convexity while managing our carry costs in good years. This introduces the risk that there will be periods where 23 will not come up as much as expected and so they will underperform more passive approaches, but over the long run, we believe they will be able to take advantage of market inefficiencies and achieve superior risk-adjusted returns.

We use an ensemble of sub-managers trading different options strategies in different markets to gives us diversified exposure to options strategies, with both calls (bets on the market going up in a volatile way) and puts (bets on the market going down in a volatile way).​

How Does The Relative Value Sub-strategy Work?

The Relative Value strategy can profit in up markets, attempting to provide an income stream that helps us to achieve a positive carry over a risk on cycle. Our implementation of relative value managers is different from other relative value strategies because we seek out managers that have a ‘long volatility bias’ to their trading strategies. That means, they can flip and go long volatility so it can also do well in a crisis event along with the rest of the portfolio.

One example of a relative value sub-strategy we employ is to trade the relative value between the VIX and S&P or the VIX calendar term structure. For instance, a volatility arbitrage strategy might be long the VIX and long the S&P at the same time because the VIX and S&P tend to be anti-correlated. This means that if equity prices fall sharply, they would benefit from the pickup in volatility on the VIX side but lose money on the S&P side.​

The sub-managers we use here are using their proprietary algorithms to know when they want to be in the market and how to ratio the trades appropriately. If the market falls sharply and you have more exposure to the VIX than the S&P then your gains on the VIX will overcome your losses on the S&P. Getting this ratio and positioning right is what our sub-managers have spent their careers focusing on.

We also employ some short-term trend following approaches as part of this sub-strategy. One place where options struggle is after the first leg down in markets such as after the Lehman collapse in 2008. At that point, options have become more expensive because suddenly everyone wants to buy insurance. This is great for our long options sub-managers: we have all the long options and other people are scrambling to buy them and willing to pay up so the option sub-managers can perform really well in that first leg down.​​

However, after the crisis, it means that options are likely to be more expensive. If you were buying options for $1 with a max payout of $10 going into the crisis, you had 10x upside. Once options prices go up, that same option with a $10 upside may cost $3 or $4, so you have more like 2x or 3x upside. Options can still do well, but don’t have the same level of convexity at that point.​​

The short-term trend following approaches in our relative value sub-strategy can do well in this environment. They can go long and short on the futures indices such as the S&P in the United States or DAX and Hang Seng globally.

Shorting is structurally different from buying an option in that the return profile is the same regardless of recent volatility in the market. It doesn’t cost you anymore to go short after a 20% down move than it does during a low volatility period. That means short futures can help after we have a significant first leg down in markets to seek to increase our ability to provide returns as the market declines.​

These strategies can also do well in the first leg down as well, though they will not have the same level of convexity as the options sub-strategy given the instruments they are trading.

In keeping with our belief about broad diversification and using an ensemble approach, we include managers that do other variations on these approaches with a long volatility bias.

Tail Risk

Finally, we include a tail risk sub-strategy alongside our other three strategies. Unlike our Long Options sub-managers which are coming in and out of the market at different times and in different sizes, the tail risk sub-strategy is in the market 24/7 and 365 days a year. This offers us increased certainty in the case of a large sell off.

All of the active sub-managers in our other strategies are providing a valuable service because they are using their proprietary experience and algorithms to try and outperform passive long volatility approaches.

We believe that combining sub-managers in an ensemble approach helps to increase the odds that they are going to capture an event. Because we are using multiple sub-managers across multiple strategies, if one or two sub-managers miss a big sell off, the ensemble can still do well as others would catch it.​

However, our other sub-managers are typically engaging in some form of market timing which seeks to limit their losses and increase their gains. This timing usually involves a reliance on market data and so does not manage exogenous events. For instance, a war breaking out on a Sunday would not be reflected in any market data from the prior trading day on Friday. The Tail Risk sub-strategy accepts the slightly higher bleed that can be associated with ‘always on’ protection in exchange for being able to protect against exogenous ‘tail risk’ events such as war or, dare I say, an unexpected pandemic.

This should help us protect against an exogenous event that our sub-managers’ algorithms won’t pick up as it’s not showing up in market data such as a 9/11 style event. It also enhances our convexity in the case of a sharp sell off.​

How Scalable Is The Volatility Strategy?

There is a good deal of room for the strategy to scale, given the desire and ability to add sub-managers and further diversification across strategy ‘sub-strategy’. The main limiter to the scale and strategy capacity will be the capacity of sub-managers themselves, and exchange position limits across the total portfolio; however, we currently believe capacity constraints wouldn’t be experienced until around $1 Billion in assets.

What Is The Type Of Environment Where You Expect The Volatility Strategy To Struggle?

Mutiny’s Volatility Strategy is designed to do well in periods of increasing volatility and/or decreasing US stock prices. It is expected to struggle in periods of decreasing volatility and/or increasing stock prices. Slowly grinding up markets like 2017 and 2019 are challenging environments for us, but good environments for short volatility assets such as stocks, bonds, and real estate. As we believe investors should hold both long and short volatility assets, our goal for the Volatility Strategy is to be flat to slightly positive over a risk on cycle when short volatility assets perform well.

The Volatility Strategy would also struggle in a flat and low volatility market such as 2015 where equities could also struggle. We would point out that the opportunity cost of holding it is relatively low over these periods since most other assets would be mostly flat as well.​

It could also struggle in a slow grind down for markets where markets were falling with low levels of volatility. We employ different strategies such as our Commodity Trend Strategy which can do well in a protracted grind down in our Cockroach Portfolio to help cover this possibility. In general, we feel that long volatility and trend-following strategies work well together and we employing both as part of our Cockroach Portfolio.

Our Defense Strategy also contains a blend of the Volatility Strategy and Commodity Trend Strategy for investors looking for broad-based defensive allocation.

There is a strong historical anti-correlation between volatility and equity prices which is why we believe it is an effective diversifier. That being said, there have been and will always be periods where implied volatility and equity prices drift down at the same time.

Consider that a VIX of 30 means option prices are reflecting 30% annualized volatility, which equates to roughly 2% daily moves and about 8.6% monthly moves. That means equities can fall 1.5% per day or 8.5% per month, and volatility would still be lower than what is expected from a VIX print of 30, causing the VIX to fall alongside the market.

Based on our historical research, we believe it’s the case that these periods are short-lived. Either equity prices rebound within a few months, or, if equity prices continue to decline, then volatility picks up, however, it’s certainly possible to have a ~6-12 month period (or longer) of both falling equity markets and flat to declining volatility where both Mutiny’s Volatility Strategy and Volatility+Stocks Strategy would struggle.

It is not clear if the Volatility Strategy will perform well in an inflationary scenario. Some people believe that inflation creates instability and therefore higher volatility environments. However, no one has traded volatility products in an inflationary environment.

The last time we saw significant inflation in the US in the 1970s, the volatility markets didn’t exist in anything like their current form so we do not count on the Volatility Strategy to do well if we were to see significant inflation, though it is possible. For investors concerned about inflation, our Commodity Trend Strategy is more directly designed to do well in an inflationary scenario.

Though we do not anticipate such an event, the worst case scenario is always a complete loss of capital.​

Is The Volatility Index (VIX) A Good Proxy For The Volatility Strategy’s Expected Performance? In What Instances Could The Two Diverge?

The Volatility Index (VIX) is a common measure of stock market volatility. It uses option prices to gauge expectations for the speed and severity of market moves. If options are expensive, it suggests that market participants are worried and willing to pay more for insurance. If they are cheap, it suggests participants are unconcerned.​​

The options prices that feed into the VIX calculations are only designed to be forward looking – about 30 days out – so it’s an estimate of short-term volatility expectations. This makes it an imperfect, but useful proxy for long volatility as an asset class. As a result, so many investors expect a long volatility investment to perform similar to the VIX.

The historical average of the VIX is around 20 though it tends to be bimodal: clustering around 12-15 in calm years for the market and then clustering around 25-30 in volatile years.

The relationship between VIX, volatility, and the performance of the Volatility Strategy is incredibly complex. In 8 out of 10 cases, it would be fair to expect the Volatility Strategy to do well when the VIX appreciates more than +10 points.

Unfortunately, we could write a PhD thesis on the 9th and 10th cases.

From a structural perspective, the VIX is not an investable index. Consider October 2020 as an example. While the VIX did rise sharply month-over-month, investable instruments tracking volatility were up much less. Front-month VIX futures, for example, were only up 7.5% despite the VIX index climbing some 45%.

Why such a discrepancy? A simplified answer is that the VIX is a measure of volatility expectations for a certain time frame, and the investable products have different time frames and structures.

VIX is measuring “floating strike vol” when we buy “fixed strike vol”. As a toy example: say the VIX is at 10, but you buy a Put -5% OTM. You are paying up for skew and Implied Vol is priced at 15.

So, as the market moves down to your strike the VIX goes from 10-14, a “+40% increase”, but your Puts are down 1 vol point, from 15 to 14, so you are actually down -6.6%.

Part of what we are seeking to do by employing an ensemble of active sub-managers is to reduce the “bleed” typically associated with long volatility and tail risk strategies. This means sub-managers may risk bleeding more than a naive tail risk strategy (such as simply buying puts) over any one day, month, or quarter in order to limit the overall bleed of their tail risk protection schemes over a full market cycle.

They employ a variety of strategies to accomplish this including:

  • Selling short index futures on overnight weakness
  • Buying calls when the market is back near all-time highs
  • Betting on the typical market down/VIX up and market up/VIX down relationships
  • Delta hedging and gamma scalping

While track records and stress testing indicate to us that these strategies have long-term positive expectancy, there can and will be periods when such strategies are “out of phase.”

There will be large down moves in Europe that whipsaw back to breakeven during the US session. There will be exposure to long call options that lose value as the market takes a breather from a 30% rebound. There will be weeks and months where the VIX sells off alongside the stock market, breaking the typical negative correlation between the VIX and S&P.

The goal of diversification is to reduce the odds of all of these things happening at the same time, though there will still be some instances in which many of them coincide.

This is how the alpha seeking active trading we employ works. We are risking something (in this case a bit more bleed in the short term) to seek to gain something greater (much less bleed over a full market cycle).

We believe that the core long options and tail risk components of our portfolio will act in an “as expected” / “instant on” sort of way during volatility spikes and significant market sell-offs.

The relative value pieces of the portfolio, which were included to seek to limit bleed over a full risk-on cycle, will act more independently and provide lumpier (sometimes on/sometimes off) type returns.

The Volatility Strategy was primarily designed in an effort to offset much larger moves down in equity markets: the type that is ultimately most damaging to long-term compounded growth.

Our goal is to help investors improve the long-term, risk-adjusted performance of their portfolios. We believe The Volatility Strategy, when combined and rebalanced with other long volatility and short volatility assets is the best way to do this.

For a more in-depth answer, please see What is the VIX and How is it Traded?

What Does Hypothetical Results Mean? How Were The Backtests Performed?

The Mutiny Funds’ Volatility Strategy was launched on April 17, 2020. All performance since then is live performance.

Our Long Volatility Strategy Presentation available to QEP investors also includes hypothetical performance going back to January of 2016. 

While the Volatility Strategy was not live for all the years shown in the back tests, most of our sub-managers at the time of launch were. As a result, we are able to use their live track records. The whole back test is hypothetical in the sense that those sub-managers have never been combined in this way before, and were combined in such a manner with the benefit of hindsight. The regulations refer to this type of performance as Hypothetical Composite Performance.

We use actual sub-manager returns where available (which it typically is, though not always) and their own backtests or proprietary performance when not.

What Are The Fees Charged By Mutiny?

For the Volatility Strategy, the fee structure is a 1% management fee and a 10% incentive fee.

We use a “high watermark” for the Volatility Strategy meaning investors are only assessed an incentive fee on net new profits. As an example, if you were to invest $100k and the value of your investment goes down to $95k then up to $105k, you would only pay the incentive fee on the $5,000 gain from $100k to $105k.

Volatility + Stocks
Strategy DDQ

Updated: October 12, 2023

Disclaimer:
The following is designed to be informative in nature, but is not exhaustive and should not be considered apart from the full disclosures contained in the Fund’s offering memorandum. Any offer or solicitation of the Fund(s) may be made only by delivery of the Memorandum(s). There are no guarantees the strategy will perform as expected or designed, and any information described herein may change or evolve without notice. All discussions of costs relate solely to the U.S. Funds – Cockroach Fund, LLC and Long Volatility Fund, LLC. Investors into Mutiny Cayman Funds, Ltd. may be subject to other costs.

How Does The Volatility+Stocks Strategy Work?

The Volatility+Stocks Strategy seeks to provide a hedged equity exposure in a capital efficient vehicle combining passive S&P 500 futures exposure with the Volatility Strategy and a daily rebalanced option overlay strategy.

To briefly explain the mechanics: Because the bulk of the tail risk and convexity trades put on by Volatility Strategy sub-managers in the fund are done using the futures markets, the mechanics work differently than investors accustomed to equities are familiar with. When trading futures, you have to post margin to control the positions, but do not need to use your entire cash balance.

What this looks like in practice is needing somewhere between 10% to 50% of the nominal size of the exposure in the account to put on and maintain those positions. So, for example, you could get $1 million worth of futures exposure with just $100,000-$500,000 in the account. Because of this natural leverage built into futures markets and the cash efficiency it affords – there is sufficient capital to put on more than 100% exposure of the cash amount.

If you’re not familiar with futures and would like to learn more, this video starting at 4:14 is a good explanation of how this type of notional leverage works in futures. This post from our partner RCM Alternatives goes into further detail.

The Volatility+Stocks Strategy includes two major sub-components.

First, it combines a passive S&P futures position with Mutiny Funds’ Volatility Strategy in a capital efficient way. Using the above example, and assuming the Volatility+Stocks Strategy has $1 million in assets, the Volatility Strategy $1 million in exposure, the Volatility+Stocks Strategy would add another $1 million in “stock” exposure for another $200,000, resulting in total exposure of $2 million on the cash invested. The S&P futures are passively held and rebalanced with the Volatility Strategy exposure monthly when our sub-advisors accept monthly subscriptions and redemptions.

Additionally, we also include a daily rebalanced strategy of long S&P futures position with an option overlay strategy tilted towards downside protection. Similar to our Volatility Strategy, the option overlay strategy seeks to provide minimal drag in good years while covering S&P losses on a 1:1 basis.

However, it has the advantage of being able to rebalance daily as we are doing it in a single account with a single sub-advisor. We believe that the additional rebalancing frequency will help the overall performance of the Volatility+Stocks Strategy.

We think of it in this way:

  • Half the Volatility+Stocks Strategy exposure has a S&P exposure with a diversified long volatility strategy (our Volatility Strategy) that is rebalanced monthly.
  • Half the Volatility+Stocks Strategy exposure has a S&P exposure with a more concentrated long volatility strategy (our Volatility Strategy), but that is rebalanced daily.

Sticking with the example of the Fund having $1 million in assets in the Volatility+Stocks Strategy, it would get $4 million of total exposure:

  • $1 million of S&P exposure paired with another $1 million of exposure to Mutiny Fund’s Volatility Strategy rebalanced monthly.
  • $1 million of S&P exposure paired with another $1 million of exposure to our option overlay strategy rebalanced daily.

We believe this combination of one long volatility strategy that is more frequently rebalanced with another long volatility that is more diversified allows to use this amount of leverage in a way that will still mitigate drawdowns while providing superior compound growth in the long run than either approach alone. Further, it offers significant fee efficiency to our investors as a $1 million investment gets $4 million in exposure but Mutiny’s management fees are assessed only on the $1 million invested.

Where Can I Get More Information About The Volatility Strategy Used In The Volatility+Stocks Strategy?

Please see our Volatility Strategy page for more information including

  • Historical returns
  • A full breakdown of all costs associated with the strategy
  • Descriptions of the overall portfolio constructions
  • Explanations of each of the sub-strategies
  • Expected correlation to popular volatility indices such as the VIX
How Much Should I Invest In The Volatility+Stocks Strategy?

The question of how much you should invest is, of course, unique to your situation and nothing we say here is a substitute for speaking with a financial advisor or the use of your own judgment. Having said that, we can offer a few ways of how we personally think about it.

We believe that the best combination of offensive assets and defensive assets is approximately equal weight as embodied in our Cockroach Strategy.

In that framework, volatility and stocks each account for approximately 20-25% of the total exposure across the portfolio. Investors wishing to follow that guideline would then need to allocate ~20-25% to the Volatility+Stocks Strategy.

Some investors like to think of the Volatility+Stocks Strategy as a hedged equity program that fits into their equity sleeve in which case they could size it however they deemed appropriate given their views on portfolio construction.

Of course, your investment amount is a personal choice and you should consult with your financial advisor and exercise your own good judgment.

Where Does The Volatility+Stocks Strategy Struggle?

One case where the Volatility+Stocks Strategy is likely to struggle is in a relatively small equity market decline. The Volatility Strategy is not designed to kick in on a down move of less than -10% in the S&P. That means we expect that there will be periods where the S&P is down 10% and the Vol Strategy is also down 10% and so the Volatility+Stocks Strategy will be down -20% over that period. Our expectation is that if the market continues to sell off, the Volatility Strategy is designed to kick in and start performing and offset the losses in the S&P. If the market bounces back (as it did in June ’19 for instance) then the short volatility position will perform well.​

Similarly to the Volatility Strategy, the Volatility+Stocks Strategy would also struggle in a slow grind down for markets where markets are falling with low levels of volatility. It is our opinion that it is historically unusual for markets to experience large declines with low levels of volatility. Markets tend to “take the stairs up and then elevators down”. They slowly grind upwards most of the time then sell off rather sharply when everyone rushes for the exits causing volatility to pick up.

The Volatility+Stocks Strategy could also struggle in an inflationary or stagflationary environment. While it could do well in that environment depending on the level of volatility and S&P performance, there is nothing in the Volatility+Stocks Strategy specifically designed to handle an inflationary or stagflationary environment.

Just as we believe in the ensemble approach within our own products, we believe investors would be prudent to incorporate our long and short volatility products into a broader portfolio and ensemble that could capture other path dependencies such as gold or commodity trend strategies that can do well in inflationary environments as we do in our Cockroach Strategy.

Though we do not anticipate such an event, the worst case scenario is always a complete loss of capital.​


What Are The Fees On The Volatility+Stocks Strategy?

For the Volatility+Stocks Strategy, The fee structure is a 1% management fee on the cash amount invested and a 20% incentive fee based on outperformance of the Vanguard Balanced Index Inv Mutual Fund ($VBINX), a fixed 60/40 balanced portfolio that provides broad U.S. equities and U.S. investment grade bond exposure.

The intent of the Volatility+Stocks Strategy is to provide investors with hedged equity exposure. The most common implementation of this is the 60% stock/40% bond portfolio which $VBINX represents.

The Volatility+Stocks Strategy attempts to provide a more robust return stream with lower drawdowns and a shorter time between new highs, similar to the intent of most investors using a 60/40 approach, but we feel the Volatility+Stocks Strategy is a better implementation to achieve that goal. This fee structure attempts to give investors the performance of a 60% stock/40% bond portfolio (as represented by $VBINX) with no additional fees and only charge fees on performance above that level.

To give an example of how fees would be charged:

Assume $1,000 invested into both Mutiny’s Volatility+Stocks Strategy and $VBINX on January 1. If Mutiny goes down to $900 and $VBINX stays flat in Q1, Mutiny receives no incentive fee as the Volatility+Stocks Strategy would have unperformed its benchmark.

If in Q2, the Volatility+Stocks Strategy goes from $900 to $1100 and $VBINX goes from $1,000 to $1,100. No incentive fee is charged because the Volatility+Stocks Strategy is only equal to the benchmark. There is no net outperformance and so no incentive fees are paid.

In Q3, the value of the $VBINX benchmark goes from $1,100 to $1,200 and the Volatility+Stocks Strategy goes from $1,100 to $1,300. There is an incentive fee charged on the 100 points of outperformance ($1,300 for the Volatility+Stocks Strategy vs. $1,200 for the $VBINX benchmark).

In Q4, if the benchmark ($VBINX ) goes from $1,200 to $1,000 and the Volatility+Stocks Strategy goes from $1,300 to $1,200, there is an incentive fee on the 100 points of outperformance by the Volatility+Stocks Strategy.

In effect, the intention is for our investors to get 60/40 performance without paying any incentive and then assessing an incentive fee only on outperformance over that benchmark


Commodity Trend Strategy ​DDQ

Updated: October 12, 2023

Disclaimer:
The following is designed to be informative in nature, but is not exhaustive and should not be considered apart from the full disclosures contained in the Fund’s offering memorandum. Any offer or solicitation of the Fund(s) may be made only by delivery of the Memorandum(s). There are no guarantees the strategy will perform as expected or designed, and any information described herein may change or evolve without notice. All discussions of costs relate solely to the U.S. Funds – Cockroach Fund, LLC and Long Volatility Fund, LLC. Investors into Mutiny Cayman Funds, Ltd. may be subject to other costs.

How Did You Construct The Commodity Trend Strategy?

The Commodity Trend Strategy is designed to achieve broad diversification across futures markets including stocks, bonds, currencies, and commodities (e.g. energies, metals, grains and meats). The Commodity Trend Strategy aims for greater than 40% exposure to​ commodity markets in order to maximize its ability to capture inflationary moves. The exposure to currencies, bonds and equities is intended to deliver so-called ‘crisis alpha’ during prolonged declines in equity markets such as the 2008 Financial Crisis.

What Markets Does The Commodity Trend Strategy Trade?

Some of the markets it can trade include:

Stocks
  • e-mini S&P 500 Index
  • Euro STOXX 50 Index
  • FTSE 100 Index
  • Topix
  • Hang Seng Index
  • Nikkei 225 Index
  • S&P Canada 60
  • MSCI Singapore
  • CBOE Volatility Index
  • SPI 200 Index
Bonds
  • 10-Year Australian Govt Bond
  • 2-Year Australian Govt Bond
  • 5-Year U.S. T-Note
  • 2-Year U.S. T-Note
  • 10-Year U.S. T-Note
  • Schatz
  • Euro German Bobl
  • Euro German Bund
  • Long Gilt
  • Canada 10-Year Govt Bond
  • 10-Year Japanese Govt Bond
  • Long-Term Italian Govt Bond
  • Euro-OAT
  • Euro Buxl
  • U.S. T-Bond
  • Listtra 10-Year U.S. T-Note
  • Listtra T-Bonds
  • Eurodollar
  • 3-Month EURIBOR
  • Canadian Bankers Acceptance
  • 3-Month Euro Swiss Franc
  • 3-Month Sterling
Currencies
  • British Pound
  • United States Dollar
  • Canadian Dollar
  • Euro
  • Japanese Yen
  • Mexican Peso
  • Australian Dollar
  • New Zealand Dollar
  • Swiss Franc
Energy
  • WTI Crude Oil
  • Brent Crude
  • ECX EUA Emissions
  • Gas Oil
  • Crude Oil
  • NY Harbor ULSD
  • Henry Hub Natural
  • Gas
  • Gasoline RBOB
Softs
  • Cocoa
  • CoffeeSugar #11
  • Cotton #2
  • Robusta Coffee
  • London Cocoa
  • White Sugar (#5)
Meats
  • Feeder Cattle
  • Live Cattle
  • Lean Hogs
Grains
  • Soybean Oil
  • Corn
  • Soybeans
  • Soybean Meal
  • Wheat
  • Milling Wheat
  • KC Wheat
  • Canola
Metals
  • Gold
  • Copper (COMEX)
  • Aluminum
  • Nickel
  • Copper (LME)
  • Zinc
  • Platinum
  • Silver
How Does The Commodity Trend Strategy Compare To Other Trend Following Approaches?

The Commodity Trend Strategy seeks to differentiate itself from other trend following approaches by achieving broad diversification across three different dimensions.

  1. Asset Class Exposure – what asset classes trends are being identified and traded on.
  2. Trend Models – what techniques or signals are used to determine what qualifies as a trend.
  3. Timing and Lookback Periods – the time period over which a trend is being identified.


Asset Class Exposure

For asset class exposure, the Cockroach Portfolio Commodity Trend sub-strategy diversifies across many commodities markets as well as stocks, bonds, and currencies.

A broadly diversified trend following approach can cover financial markets like stocks, bonds, and currency markets in addition to commodity markets like energies, softs, grains and precious metals.

Many modern trend strategy implementations do not include very significant allocations to commodities which may impact their ability to perform well in an inflationary environment.*1 The primary role of trend in the Cockroach Portfolio is to perform well in an extended period of inflation. The Cockroach implementation of trend tries to keep at least 30% (and ideally more like 40% to 50%) of its exposure in commodities as part of it’s goal to perform well in inflationary periods.


Trend Models

There are many techniques to identify what constitutes a trend. One popular one is a moving average crossover where you look back at the 120 day moving average. If the price goes above that, you go long. If it goes below that, you go short. Trend strategies gained their first wave of popularity in the 1970s and practitioners have developed many other techniques with empirical support such as the double (and triple) moving average crossover, Donchian System, and Bollinger Bands.*2

Source: RCM Alternatives. Past Performance is not indicative of future results. All data from Bloomberg.com.

In essence, these different trend models are all seeking to accomplish the same basic goal of identifying a trending market (up or down) and following the trend but defining what constitutes a trend in somewhat different ways.

As we believe there is reasonable support for all these approaches, we take the position that diversifying across them will produce the best long term results.

Timing and Lookback Periods

Similarly, trend strategies can use different look-back periods. Instead of a 200 day moving average crossover, a shorter term Trend model might use a 50 day moving average crossover. A longer term model might use a 200 day moving average crossover.

The challenge with trend strategies is that different trend models and look-back periods can substantially change the returns of a strategy, a form of timing luck.*3

A painful example for many longer-term trends following strategies was the March 2020 sell off, where the market moved sharply down and then sharply back up. Many strategies using longer lookbacks sold near the bottom and didn’t get back in until the market had recovered significantly – locking in all the losses while missing out on most of the gains from the recovery.

Shorter-term strategies, by contrast, got out much sooner and got back in much sooner, which lead to superior performance.

The flipside is equally possible. After bonds declined throughout 2022, many trend followers were short bonds going into 2023. When Bonds aggressively rallied in anticipation of Fed rate cuts in the Spring, many short term trend followers took sizable losses. When the market reversed and bonds began their decline again, shorter-term trend followers missed out where many longer-term trend followers stayed in the trade the whole time and so were able to recoup some or all their losses from the bond rally.

Hoffstein (2020) found that their “…constructed indices exhibit high levels of rebalance timing luck, often exceeding [1%] annualized…” *4We believe this supports the idea that diversification within the Trend sub-strategy could improve performance compared to a single trend model or lookback timing. The Commodity Trend Strategy diversifies across lookback periods ranging from 10 days to 18 months and so seeks to more reliably capture trends wherever they show up and minimize the impact of timing luck.

While it’s tempting to try and identify the “best” signal or “best” look back period, this sort of over-fitting to history is exactly what the Cockroach Portfolio approach is trying to avoid. What was “best” over the past year, ten years or twenty years may not be best in an unknown future.

As with the other components of the Cockroach Portfolio, the goal is not to predict the future but to identify strategies that can all do well across a broad regime (inflationary periods in the case of trend) and add another layer of diversification to try and improve the long-term compounding.


*1 There are various speculations as to why this might be. The most likely seems to be that there were not a lot of trends in commodity markets in the 2010s leading to poor performance of commodity focused trend strategies which may have caused investors to shift their focus elsewhere. Additionally, commodity markets are more capacity constrained than stock, bond and currency markets so as a trend manager’s assets under management grows, they may be inclined to do less and less in commodities.

*2 Our friends at RCM Alternatives publish an annual trend following guide which goes into more detail about various Trend following models and approaches.

*3 Corey Hoffstein of Newfound Research has written extensively on the concept of timing luck and we would direct you to his research to learn more.

*4  Ibid

Commodity Trend Strategy Managers

The Commodity Trend Strategy contains an ensemble of what we consider to be blue chip Commodity Trading Advisors (CTAs). An overview of the firms and their strategies is provided below.

Chesapeake Capital Corporation (Long-Term)

Chesapeake was founded by Jerry Parker, who began his money management career in 1983 as a member of the “Turtles”, a legendary group of individuals from a variety of backgrounds recruited by Chicago money manager Richard Dennis.

The Chesapeake trading methodology is long-term trend following, utilizing robust trading systems across a broadly diversified set of markets. It is a rules-based investment approach that focuses on capital preservation, while attempting to provide positive annual returns. Utilizing diversification and robust systems, the firm’s goal is to maximize the profit in each trade by following the system entries and exits, regardless of market conditions or temptations.

They believe using robust trend following systems with minimal filters, conditions or other parameters minimizes the risk of curve fitting and positions them well for market conditions that may not have occurred in the past. They invest in over 110 markets worldwide including currencies, commodities, interest rates and equities.

The strategy is designed to approximately target an equal exposure split (25% each) between the currency, commodities, interest rate and equity markets.

Dunn (Long-Term)

Dunn’s World Monetary and Agriculture (WMA) Program is a fully diversified 100% systematic medium to long-term trend following program, encompassing a portfolio of financial, energy, metal and agricultural futures markets. The WMA Program is a compounded growth strategy. The investment objective is to extract profits from up and down trends, resulting in a return stream that exhibits very low correlation with traditional asset classes. It seeks to have a 40% allocation to commodities and has a lookback period typically in the 180-200 day range.

EMC Capital Advisors (Medium-Term)

EMC is a systematic global macro investment management firm founded in 1988. EMC’s Classic Program seeks to provide long-term positive returns with low correlations to equity, fixed income and traditional hedge funds.

EMC trades stock indices, currencies, financial futures, precious and base metals, energies, agricultural and soft commodities.

The Classic Program employs multiple proprietary independent trading systems that range in duration from 15 to 90 days. Individual systems are trend following and momentum based in nature and are designed to capture directional price movement over different time frames and under different market conditions. EMC actively manages risk at every level of the portfolio using current market volatility, account equity, correlations and other portfolio components to quantify and limit risk at the trade, market, sector and portfolio levels.

Quest Partners (Short-Term)

Quest’s flagship strategy, AlphaQuest Original (AQO) is designed to perform well during periods of volatility expansion or potential fixed income and/or equity market corrections.

By utilizing shorter-term trading time frames and focusing on positive skew, AQO seeks to benefit in environments where tail risk is most likely to materialize. Quest programs, due to their positively convexed trading style are a particularly attractive portfolio diversifier and can act as a hedge to traditional portfolios, hedge fund portfolios and CTA portfolios.

Volt Capital Management (Short-Term)

The Volt Diversified Alpha Program is fundamental in nature, primarily seeking to capture price moves that are motivated by a change in underlying economic factors, but it also uses technical information for risk management, trade timing and execution decisions.

The program trades over 80 liquid futures markets, covering the main global financial and commodity markets.

Because Volt is using economic data rather than price data as an input to their models, it should be uncorrelated to other short term trend sub-managers in good times, helping improve the carry costs, while still performing well in sell-offs.

Note: Though we strive to keep the manager list as up to date as possible, we are constantly re-evaluating the portfolio and the manager composition is subject to change without notice.

What Is The Exposure Of The Commodity Trend Strategy?

We instruct the managers to trade approximately 1.5x the cash value of the Commodity Trend Series.

Because we are trading trend strategies where we and our managers are extremely focused on eliminating any sort of blow up risk in the portfolio, this modest amount of leverage does not seem problematic, but does allow investors to be more capital and fee efficient.

However, Mutiny itself is only charging fees on the cash amount. In the case of an investor that put in $1mm, they would get $1.5mm in exposure to the underlying trend managers but only pay Mutiny’s fees on the $1mm cash.

Note that the Commodity Trend Strategy inclusion in the Cockroach Strategy does not include this leverage so the numbers there will be slightly different. E.g. If the Commodity Trend Strategy as a standalone is up +3% then the commodity trend sub-strategy included in the Cockroach portfolio will be up +2%. This is done because we believe the Trend strategy needs to be balanced within the broader Cockroach portfolio.

How Much Should I Allocate To The Commodity Trend Strategy?

The question of how much you should invest is, of course, unique to your situation and nothing we say here is a substitute for speaking with a financial advisor or the use of your own judgment. Having said that, we can offer a few ways of how we personally think about it.

We believe that the best combination of offensive assets and defensive assets is approximately equal weight as embodied in our Cockroach Strategy.

In that scenario, the Commodity Trend Strategy accounts for 20-25% of the total exposure of the portfolio. For investors seeking to use it in a similar way then, an allocation along those lines seems appropriate to us. Given the capital efficiency of our structure noted in WHAT IS THE EXPOSURE OF THE COMMODITY TREND STRATEGY, a ~13-17% allocation to the Commodity Trend Strategy would achieve this total exposure.

For investors that have a different view of the role and sizing of trend strategies in a portfolio, they are able to size their investment however they deem appropriate.

Of course, your investment decision and amount is a personal choice and you should consult with your financial advisor and exercise your own good judgment.

Where Does The Commodity Trend Strategy Struggle?

The most challenging environments for trend strategies such as the Mutiny Funds’ Commodity Trend Strategy are:

  1. Low and/or declining volatility environments without any significant market moves higher or lower
  2. “Whipsaw” markets where trends are frequently reversing.

For example, the sharp declines in volatility following the financial crisis led to poor trend performance in 2009, while several sharp ‘whipsaws’ caused losses in early 2014.

Longer-term trend managers (say using an 18-month lookback period) can fare much better during whipsaws as they would have remained invested through most of the period, but that comes with the risk of experiencing the full drawdown of a buy and hold strategy and/or missing out on the early parts of a new trend.

We seek to minimize the impact of whipsaw by including managers with short-term (~days to weeks), medium-term (week to months), and longer-term (months to years) lookback periods trading across 75+ futures markets. We believe this maximizes our chance of capturing the bulk of a move while reducing the impact of whipsaw.

What Are The Fees Charged By Mutiny?

For the Commodity Trend Strategy, the fee structure is a 1% management fee and 10% incentive fee.

We use a “high watermark” meaning investors are only assessed an incentive fee on net new profits. As an example, if you were to invest $100k and the value of your investment goes down to $95k then up to $105k, you would only pay the incentive fee on the $5,000 gain from $100k to $105k.

Defense Strategy DDQ

Updated: October 12, 2023

Disclaimer:
The following is designed to be informative in nature, but is not exhaustive and should not be considered apart from the full disclosures contained in the Fund’s offering memorandum. Any offer or solicitation of the Fund(s) may be made only by delivery of the Memorandum(s). There are no guarantees the strategy will perform as expected or designed, and any information described herein may change or evolve without notice. All discussions of costs relate solely to the U.S. Funds – Cockroach Fund, LLC and Long Volatility Fund, LLC. Investors into Mutiny Cayman Funds, Ltd. may be subject to other costs.

How Did You Construct The Defense Strategy?

The Defense Strategy is intended as a capital efficient way for investors to add a defensive component to their portfolios. It contains an investment into the same ensemble of managers in Mutiny Funds’ Commodity Trend Strategy which is intended to do well in inflationary periods and protracted recessions. It also  invested in the same ensemble of managers in Mutiny Funds’ Volatility Strategy which is intended to do well in sharp sell-offs.

What Is The Total Exposure Of The Defense Strategy?

The portfolio will have a target nominal exposure of 150%. This means that for a $100k investment that the investor will get $150k of nominal exposure to the different return drivers which includes:

  • 75% exposure to Mutiny Funds’ Commodity Trend Strategy
  • 75% exposure to Mutiny Funds’ Volatility Strategy
Defense Strategy Managers

The Defense Strategy invests in the same ensemble of managers as those contained in the Mutiny Funds’ Commodity Trend Strategy and Mutiny Funds’ Volatility Strategy

How Much Should I Allocate To The Defense Strategy?

The question of how much you should invest is, of course, unique to your situation and nothing we say here is a substitute for speaking with a financial advisor or the use of your own judgment. Having said that, we can offer a few ways of how we personally think about it.

We believe that the best combination of offensive assets and defensive assets is approximately equal weight as embodied in our Cockroach Strategy.

In that scenario, the Defense component accounts for approximately 50% of the total exposure of the portfolio. For investors seeking to use it in a similar way then, an allocation along those lines seems appropriate to us. Given the capital efficiency of our structure noted in WHAT IS THE EXPOSURE OF THE DEFENSE STRATEGY, a ~33% allocation to the Defense Strategy would achieve this total exposure.

For investors that have a different view of the role and sizing of trend strategies in a portfolio, they are able to size their investment however they deem appropriate.

Of course, your investment decision and amount is a personal choice and you should consult with your financial advisor and exercise your own good judgment.

Where Does The Defense Strategy Struggle?

We anticipate the most challenging environments for the Defense Strategy would be low or declining volatility environments without any trends such as 2019 where volatility remained relatively low and there were few pronounced price trends.

Our expectation is that offensive strategies such as equities or income oriented strategies will do well in this environment. Since the Defense Strategy is not intended as a stand alone investment, but rather as a part of a broader portfolio, we would expect that the rest of an investors’ portfolio would be generating the returns in this type of period.

What Are The Fees Charged By Mutiny?

For the Defense Strategy, the fee structure is a 1% management fee and 10% incentive fee.

We use a “high watermark” meaning investors are only assessed an incentive fee on net new profits. As an example, if you were to invest $100k and the value of your investment goes down to $95k then up to $105k, you would only pay the incentive fee on the $5,000 gain from $100k to $105k.

Current Investors DDQ

How do I Contribute Additional Funds or Redeem Funds?

To add or redeem funds, please complete our change form.

In order to accept additional funds or new investments, we need to receive the wires with funding five (5) business days before the month to make sure we are able to deploy the funds to our managers in a timely manner so we ask that you submit the change form no later than eight (8) business days before the end of the month.

Forms received later than eight (8) business days before the end of the month and wires received later than five (5) days before the end of the month will be held for allocation the subsequent month. (e.g. If the wire is received May 29, it will be invested July 1 rather than June 1 as it was not received 5 business days prior to June 1).

If you are redeeming funds, please note there are two parts to the process:

First, your investment will be reduced/end as of the last day of the month the request is made (assuming it is done before the 8 business day cut off date). For example, if you request a redemption on May 15th, your investment will be liquidated by the amount requested on the last day of May.

Second, the 3rd party administrator has to calculate the monthly performance and finalize the accounting for that month before we are able to send the full redemption payment. Because we need all of our managers to finalize their accounting before we can finalize ours, this is unlikely to be completed before month-end.

If an investor submits an online change request and subsequent signed change form document before the 8 business day cutoff date, we will send out approximately 90% of the full redemption payment by the 10th-15th of the following month. For example, any request made before the March cut off (circa March 22nd) the ~90% wire would go out around April 10th-15th. We do reserve the right to hold up to 10% of your investment until the next calendar year to finalize the audit and prevent any unnecessary back and forth, though this is not typical and we aim to finalize the full redemption within 60 days.

How Can I View My Statements Online?

You may always access prior statements by searching your email for them.

The email will be titled “Long Volatility Fund, LLC | Investor Account Statement” or “Cockroach Fund, LLC | Investor Statement” and should arrive from investor.relations@navbackoffice.com.

We do provide access to an online portal through our fund administrator, NAV Consulting. You should receive an email from them within the first few days of the month to create your login details.

There are a couple of things to note regarding the portal:

  • The portal won’t show any information until you receive your first investor statement.
  • The fund only strikes a Net Asset Value (NAV) once per month (around the 15th) so the number in the portal will only change one day per month when your statement is sent via email.

This means that the portal will not give you any additional information to what you will receive via email, merely let you access it in your browser as opposed to in an email.

If you would like access to the portal as a reference then we are happy to facilitate that. Simply complete the form at the bottom of this page and select the “I want access to the portal with my monthly statements” option from the drop-down menu.

Where Do I Receive Statements?

Monthly statements will arrive via email from our fund administrator each month.

Statements should arrive around the 20th-25 of the following month. The email will be titled “Long Volatility Fund, LLC | Investor Account Statement” or “Cockroach Fund, LLC | Investor Statement” and should arrive from investor.relations@navbackoffice.com. Please make sure to white list their email address.

Your statements will be sent to email address/email addresses submitted on the investor information form. If you would like duplicates sent to any additional addresses, please let us know.

You will also receive an estimate of fund performance on the first of each month for the prior month. Please note that this estimate is generally fairly accurate but large swings in the fund’s performance in the last week of the month can create some discrepancy and so it should be viewed as an estimate. We also send a letter with monthly commentary around the 25th of each month though the date varies depending on when we are able to finalize the fund’s accounting.

How to make changes to your account information

To make any changes to your account, please contact us for any account related requests suchs as:

  • To change your address information
  • To make changes to recipients on your monthly statements
  • To request hard copies of your statements
When will I receive Tax Documents (K1)?

Investors will receive an audited annual report with financial statements, detailing the activity and financials for the overall Fund in which they are invested.

Investors will also receive a K1 reporting their share of the prior year’s profits and losses for the Fund in which they invest. Here is an explanation of how K1s work in a fund structure if you are not familiar.

Because our funds are invested in other funds, we have to wait until we receive final audited financial statements from those funds to compile the audited annual report and K1. Those outside funds are not required to submit their audited financial statements with the regulators until March 31. We usually receive most of them around that time though it is typical for at least one or two of our managers to file an extension.

Once we have received the audited financial statements and K1s from the other funds, we will work with our third party administrator, to put together the annual financial statement for Mutiny Funds, and then turn them over to our auditor and tax preparer, Cohen & Co., to perform their certified audit of the financials.

Once that has all been completed, the annual report will be filed with the National Futures Association (NFA) and you will receive a copy. Typically this will be the end of June.

At the same time, the Cohen & Co. tax department will use the prior year’s financial statements to prepare the fund’s overall tax return and each investor’s individual K1s. These will be sent out to you as soon as we receive them.

We will do everything in our power to get investors the K1s promptly, but owing to the fact that we cannot begin our own process until we receive everything from our managers it is unlikely we will be able to send them out before June at the earliest. Based on prior years, investors should expect K1s In July or August which may require filing an extension.

As a matter of practice, we will file an extension for Mutiny’s overall tax return, given the need to wait for the third party fund’s K1s.